Biz Interceptor Summary
The Biz Interceptors tab lists every interceptor defined for the current Profile — one row per interceptor, with its enabled state, environment status, and quick-access actions all visible at a glance.
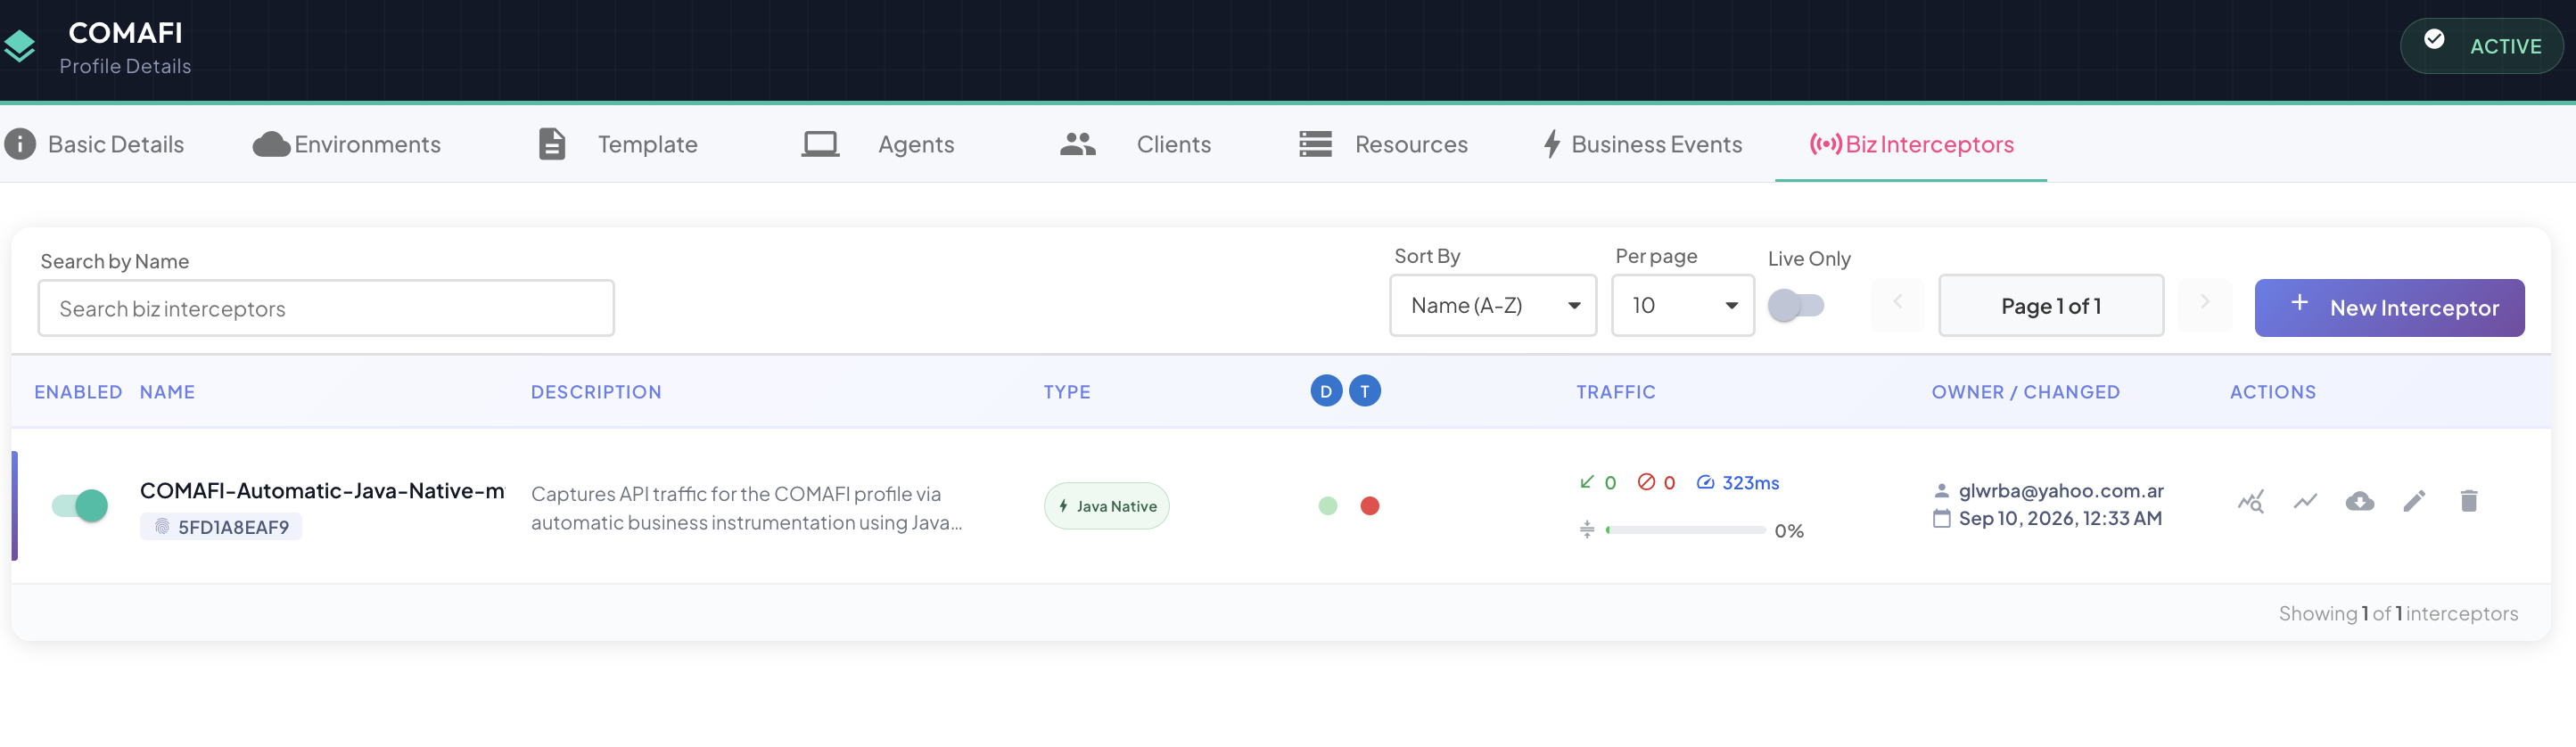
List Columns
| Column | Description |
|---|---|
| Enabled | Master on/off switch for the interceptor as a whole. Disabling it here overrides every per-environment enable flag — no environment will capture traffic while this is off, regardless of its own setting. |
| Name | The interceptor's name, with its ID shown underneath (last 8 characters). Click directly on the name to rename it inline, without opening the full Edit dialog. |
| Description | Free-text description. Click to edit inline, same as Name. |
| Type | The instrumentation type badge — the specific Interceptor Type (for Automatic) or SDK Type (for Manual) selected when the interceptor was created. Color/icon distinguish Automatic from Manual at a glance. |
| Environments | One status dot per Profile environment (see Runtime Status) — a column of single-letter initials in the header row (e.g. D for DEV01, I for IST) identifies which dot belongs to which environment. Shows — when no environment has anything to report yet. |
| Traffic | Sortable, interceptor-wide summary — see Traffic Column below. |
| Owner / Changed | The user who created the interceptor, and the timestamp of the most recent update to its own configuration. |
| Actions | Quick-access icons — see Row Actions below. |
Inline Editing
Both Name and Description can be edited directly from the list, without opening the Edit dialog:
- Click on the current value.
- The cell switches into edit mode with a text input.
- Type the new value and either press Enter or click away to commit — pressing Escape discards the edit.
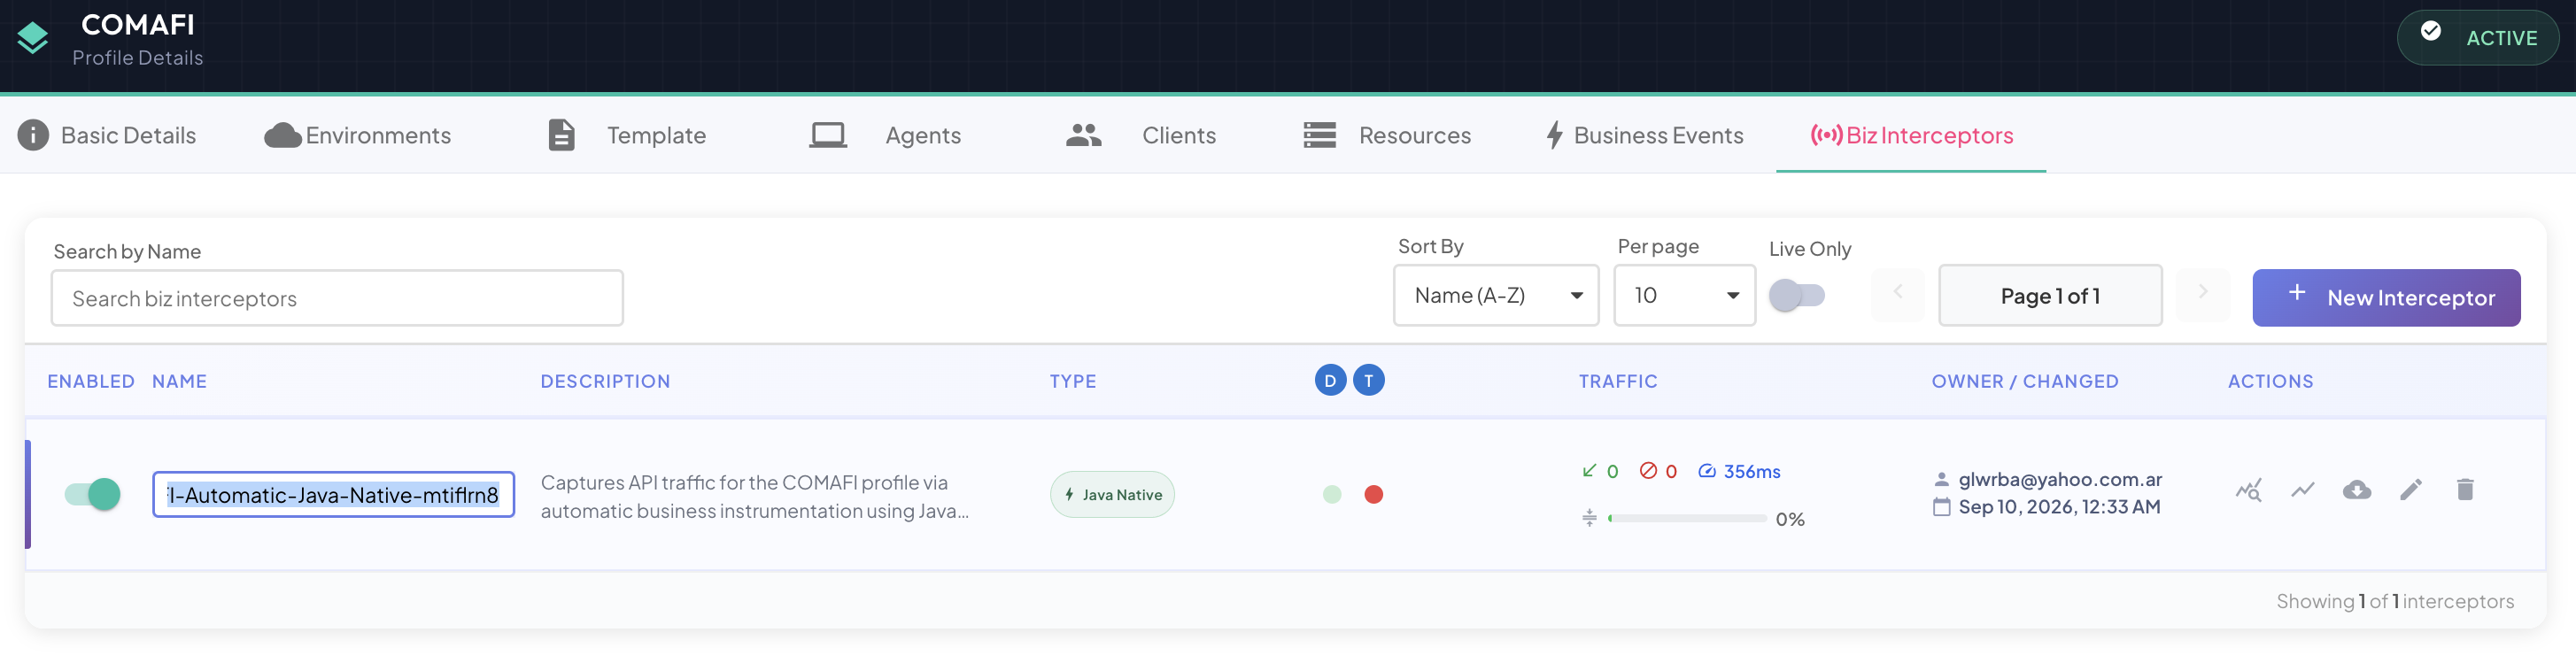
A duplicate name is rejected inline, with an error message shown right under the field.
Environment Status
Each colored dot in the Environments column represents this interceptor's live status in one Profile environment. Hovering over a dot shows a tooltip with the environment name and current status; clicking it opens a detail dialog with uptime and capture statistics for that specific environment.
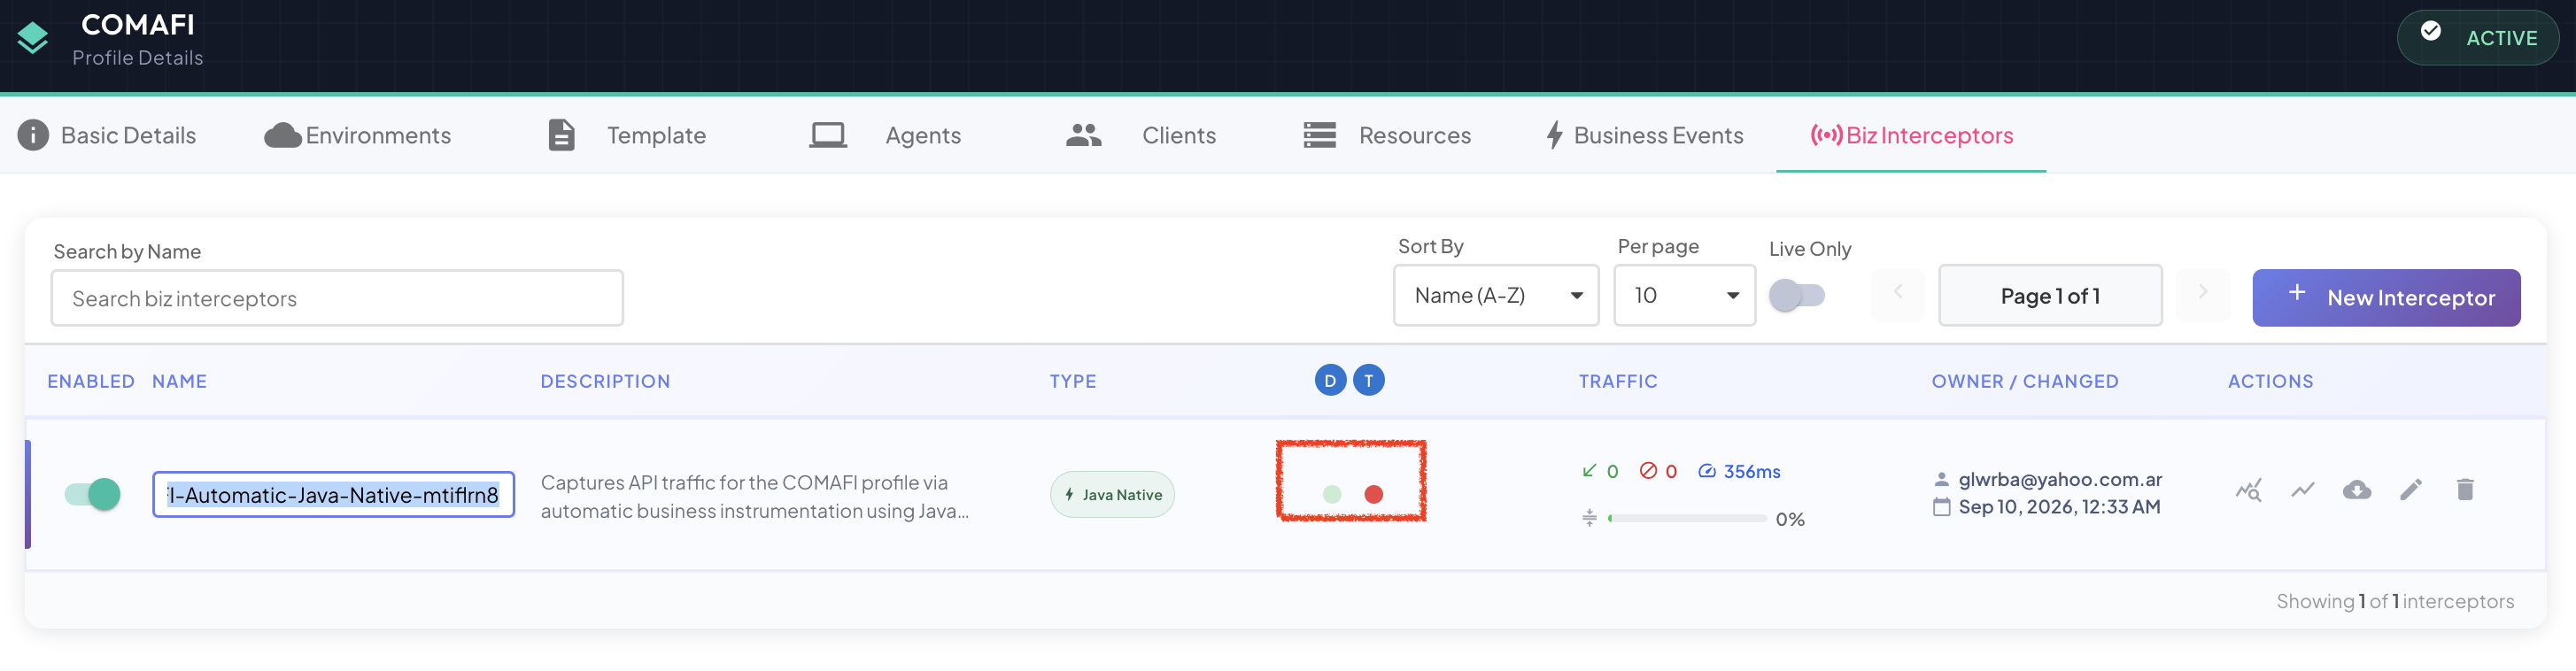
See Environment Status for the full breakdown of what each of the four states means, exact hover/click behavior, and what the detail dialog shows for each.
Traffic Column
The Traffic column packs four interceptor-wide figures into one compact, sortable cell — the same values behind Consolidated Stats' own Lifetime Totals and pressure/ping tiles, surfaced here so they're visible without opening that dialog:
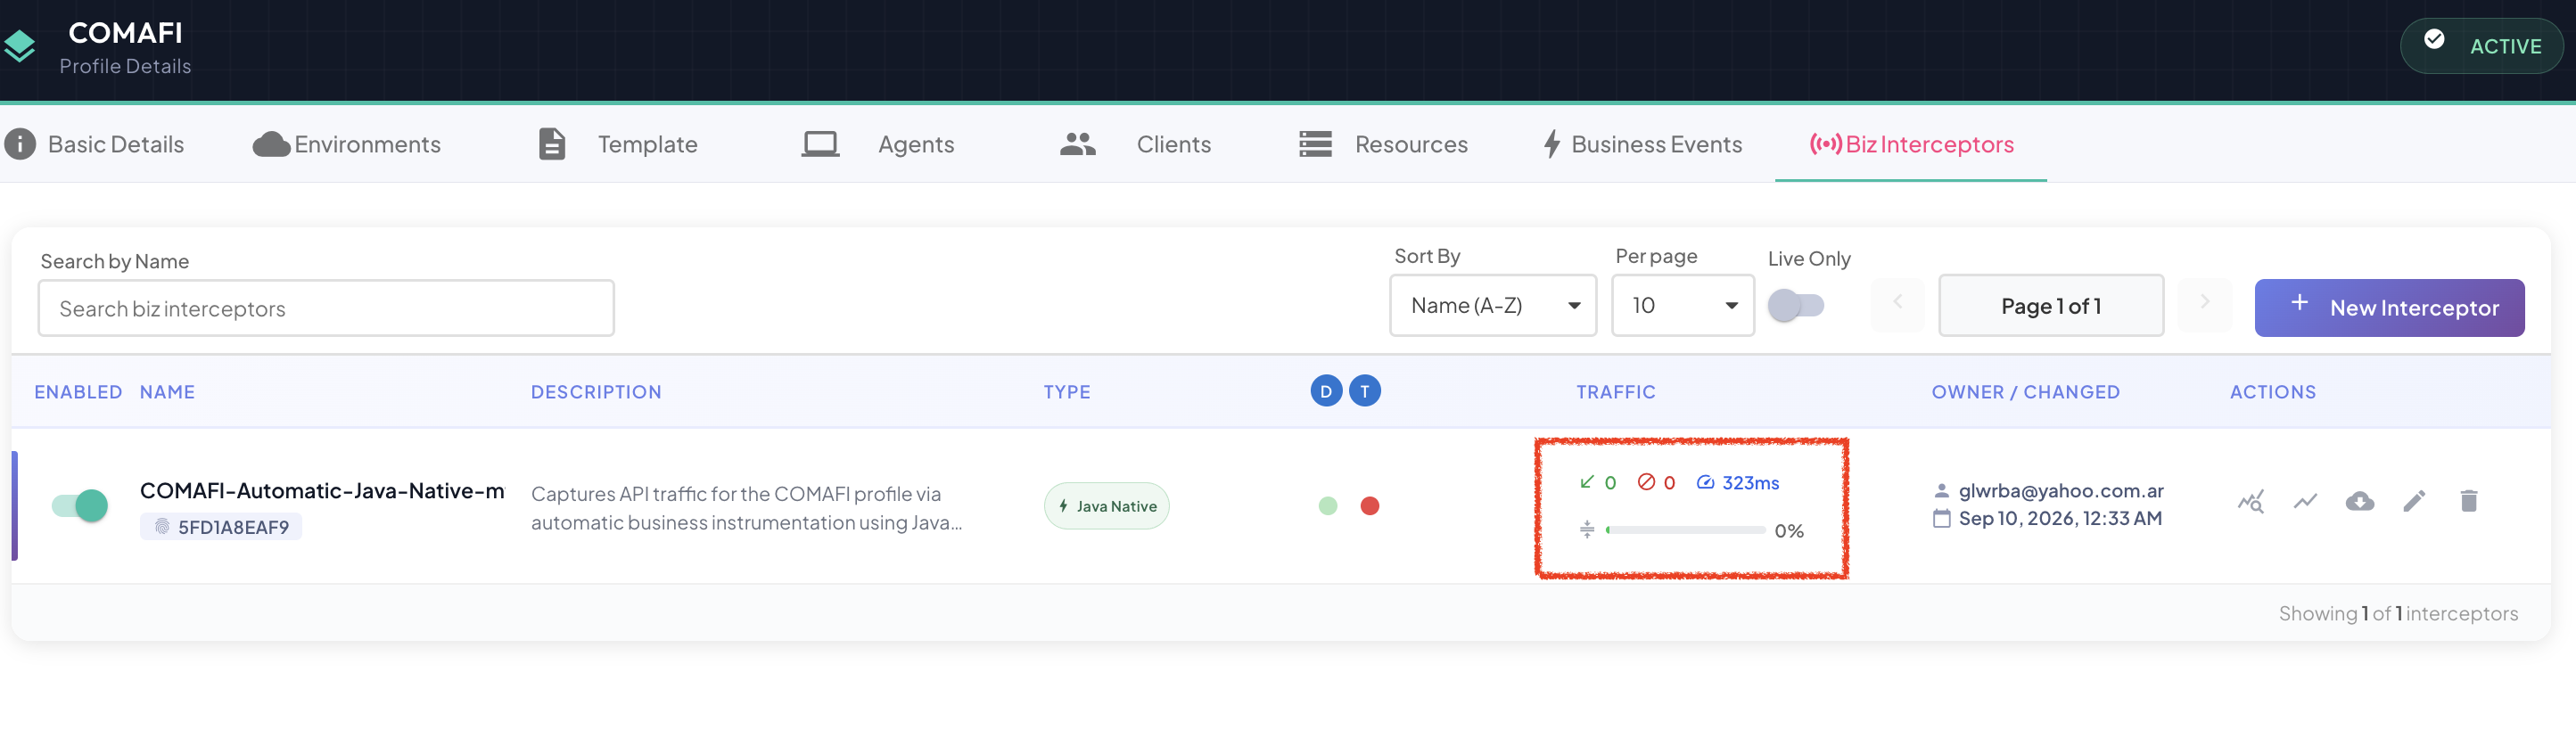
| Icon | Metric | Meaning |
|---|---|---|
| (green) | Total Captured | Every frame this interceptor has ever captured, across all its environments — see Lifetime Totals. |
| (red) | Total Dropped | Every frame ever dropped (buffer overflow, upload failure, etc.), across all environments. |
| (blue) | Avg Ping Time | Average round-trip time of /heartbeat calls to the Agent, rolled up across every environment. |
| (gold bar) | Avg Pressure | Buffer occupancy, rolled up across every environment — the same metric behind Pressure Alert. The bar's fill color shifts from green toward amber/red as pressure climbs toward its configured alert threshold. |
Hovering any of the four shows its exact, non-abbreviated value in a tooltip (large numbers are otherwise compacted, e.g. 76.61K). Total Captured, Total Dropped, and Avg Pressure can each drive the list's sort order too — see Sort By below.
Search, Sorting, and Pagination
The toolbar above the list gives you four independent controls:
Search by Name — filters the list as you type, matching against the interceptor name.
Live Only — filters the list down to interceptors with at least one environment currently Online, hiding everything that's Standby, Unreachable, or Offline across the board.
Sort By — reorders the list:
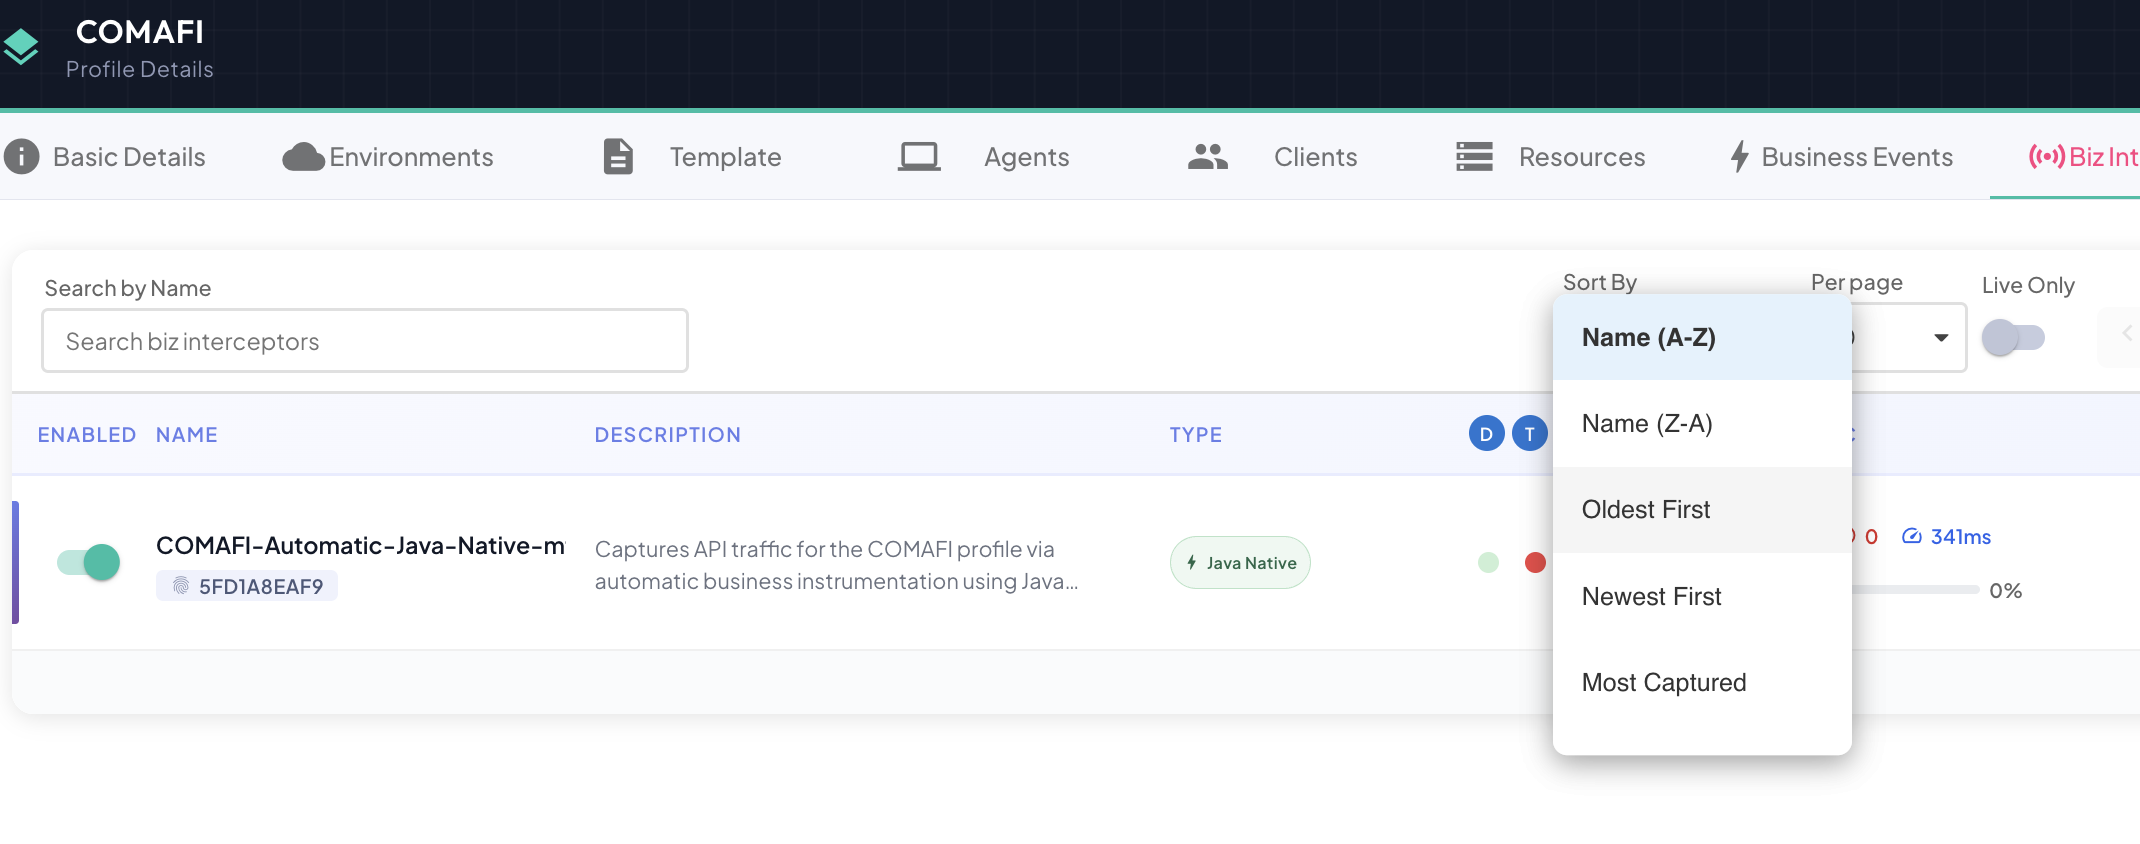
| Option | Order |
|---|---|
| Name (A-Z) | Alphabetical, ascending |
| Name (Z-A) | Alphabetical, descending |
| Oldest First | By creation date, ascending |
| Newest First | By creation date, descending |
| Most Captured | By Total Captured, descending |
| Least Captured | By Total Captured, ascending |
| Most Dropped | By Total Dropped, descending |
| Highest Avg Pressure | By Avg Pressure, descending |
Per page — controls how many rows are shown before pagination kicks in:
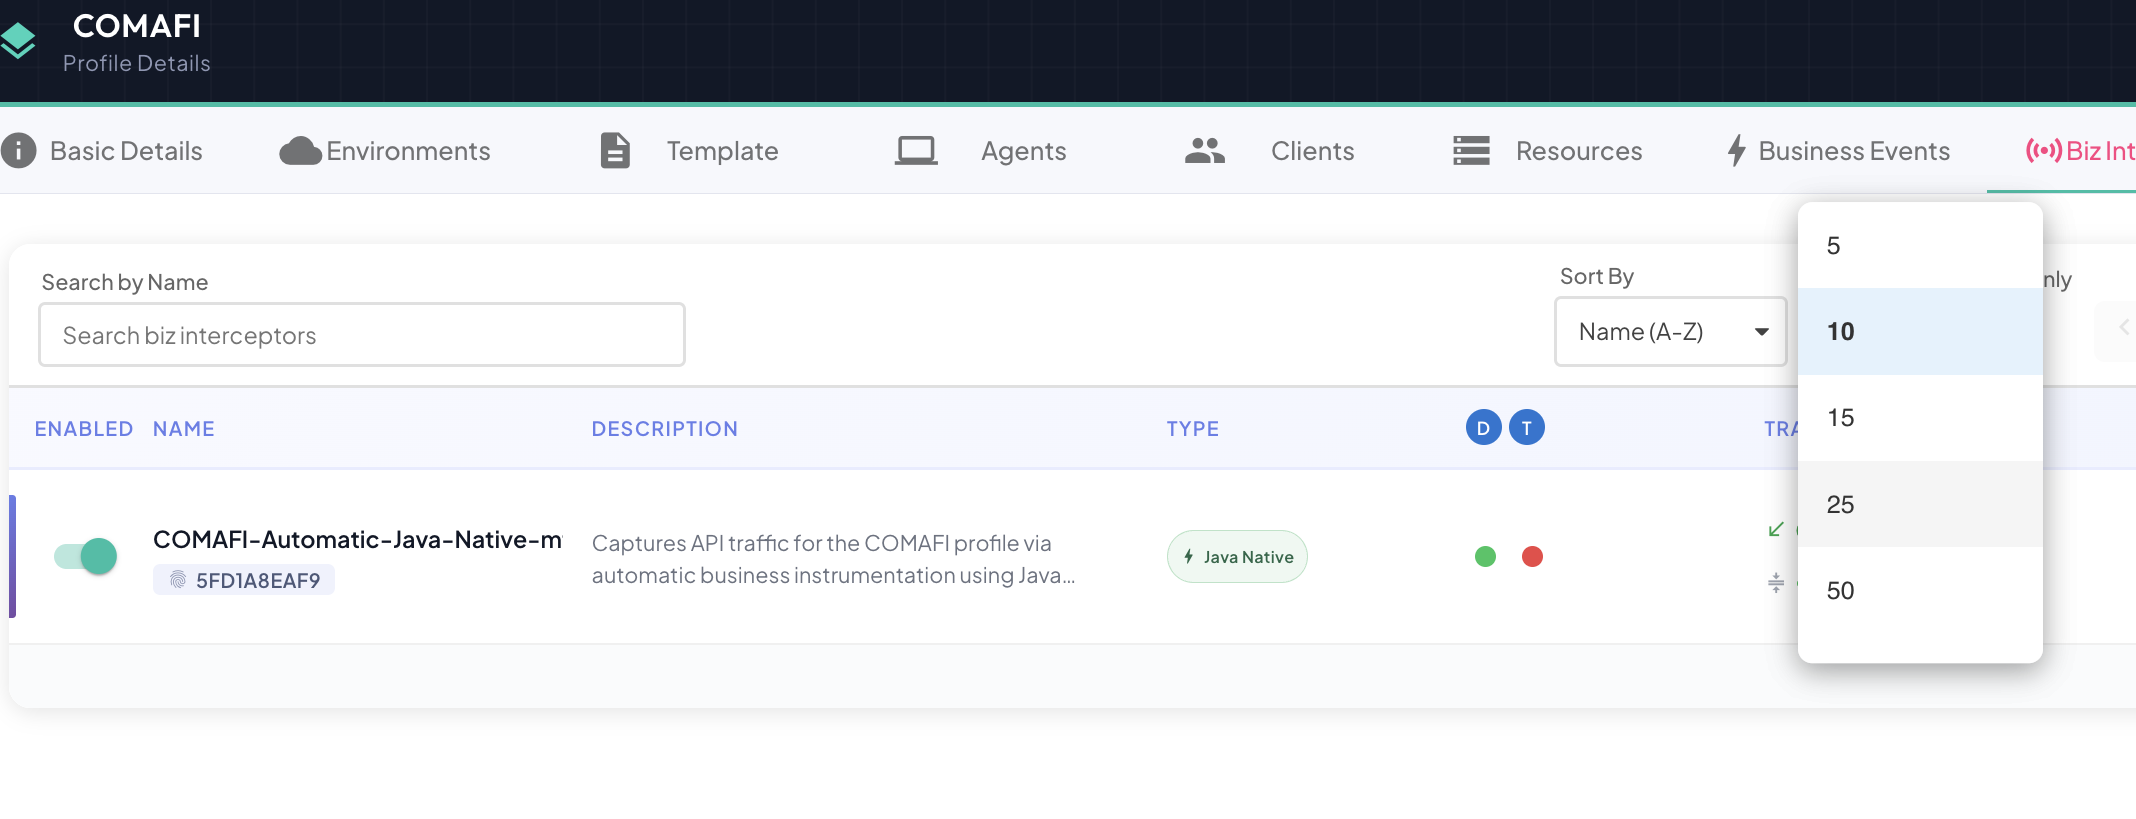
Choose from 5, 10, 15, 25, or 50 rows per page. Use the arrow buttons next to the page indicator to move between pages.
Row Actions
Each row's Actions column exposes the following, in order:
| Icon | Action |
|---|---|
| Open Consolidated Stats for this interceptor. | |
| Open the Metrics Explorer for this interceptor, scoped to all environments. | |
| Open Live Endpoints — only shown for REST API interceptors. | |
| Open the Download dialog. | |
| Open the Edit dialog. | |
| Delete this interceptor. |
Empty States
If this Profile has no interceptors yet, the list is replaced with a prompt to create one. If a search term matches nothing, a distinct "no results" message is shown instead, so the two cases are never confused with each other:
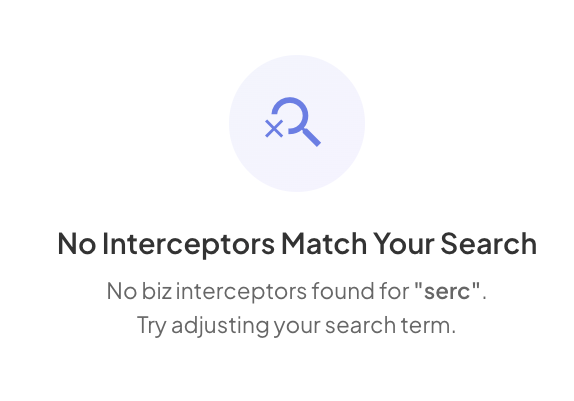
Creating a New Interceptor
Click + New Interceptor in the top-right of the toolbar to launch the Create New Interceptor Wizard.
In This Section
- Environment Status
- Creating a New Interceptor
- Reconfiguring (Editing) an Existing Interceptor
- Consolidated Stats
- Metrics Explorer
- Live Endpoints
- Downloading a Biz Interceptor
- Deleting an Existing Interceptor
- Interceptors Panel — this same list, but account-wide across every Profile