Biz Interceptor Metrics Explorer
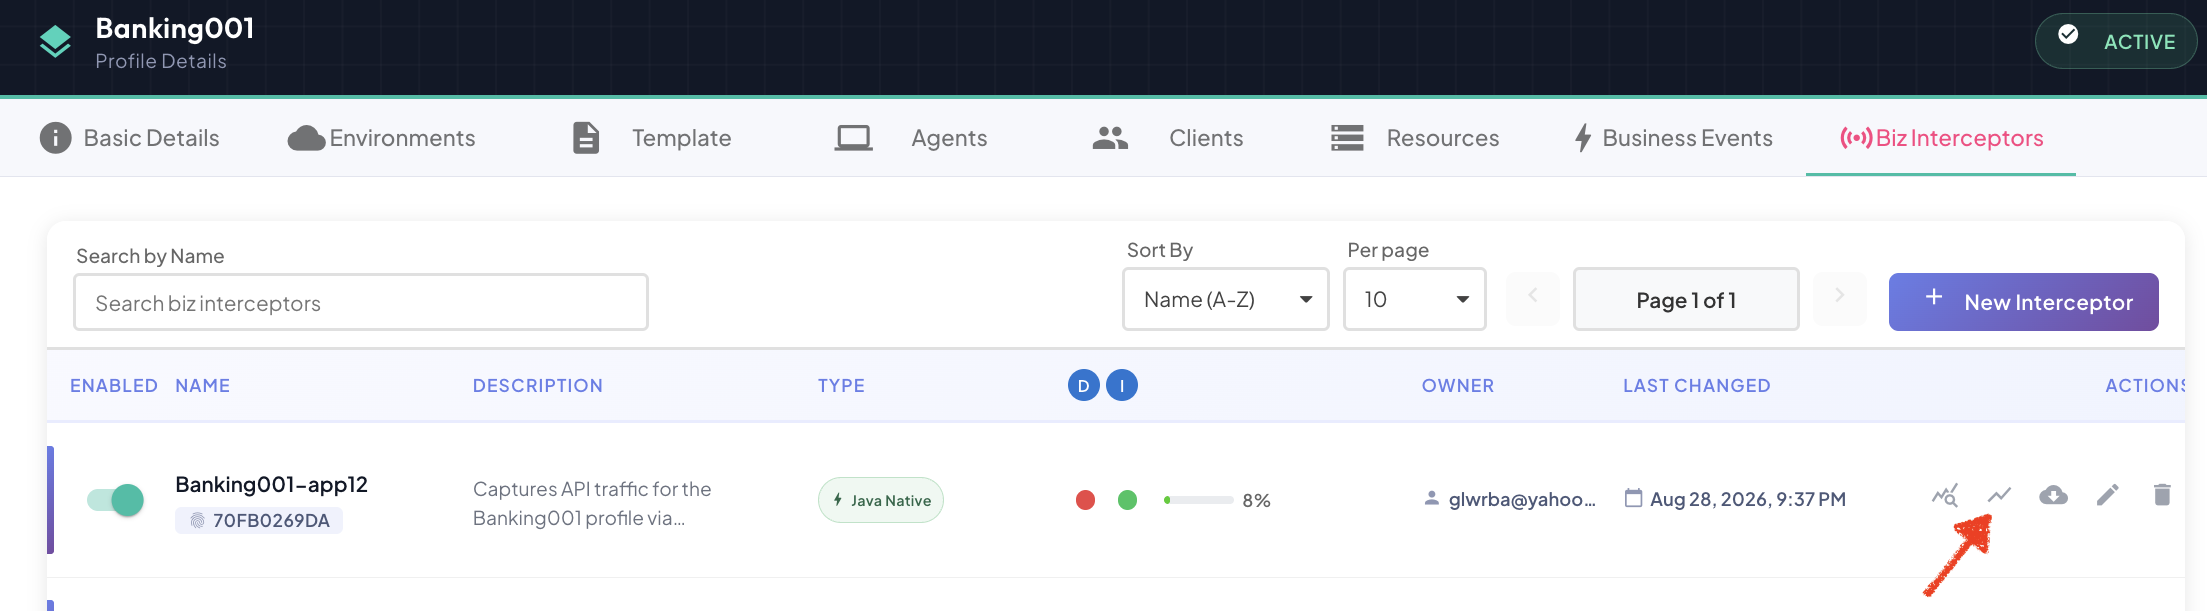
Click the icon on any row of the Biz Interceptor Summary to open Metrics Explorer — a time-series chart of this interceptor's historical capture metrics, aggregated into configurable time buckets.
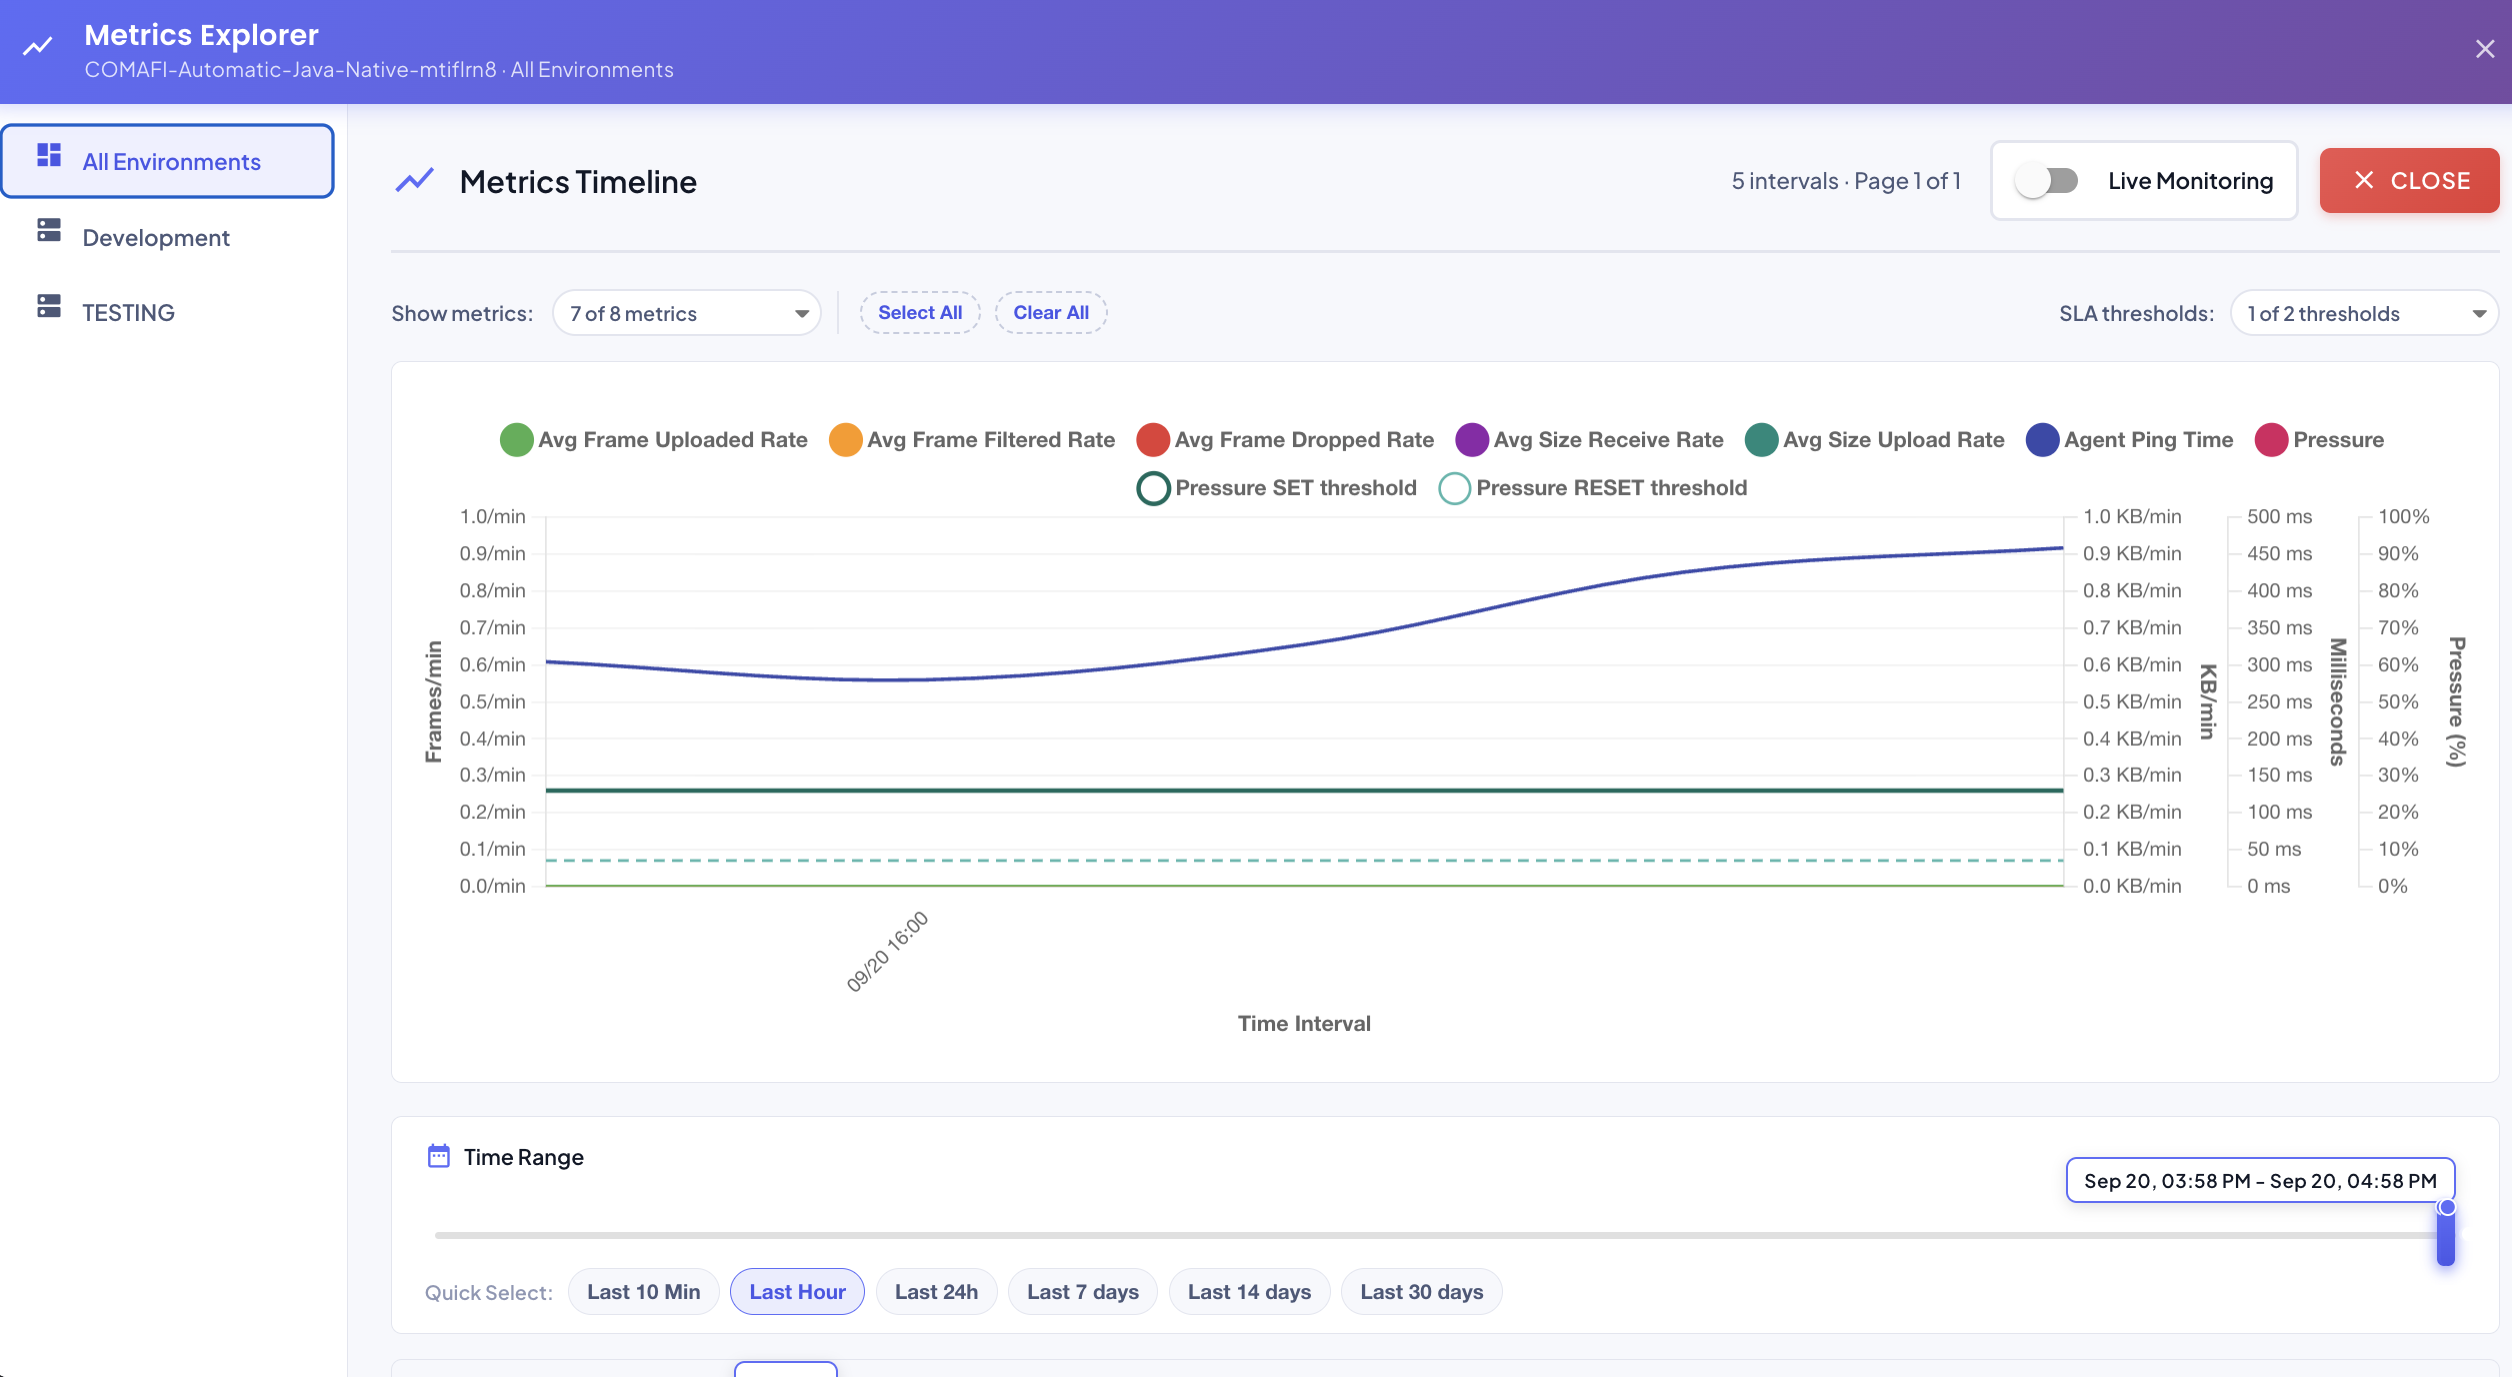
Where Consolidated Stats shows running totals as of right now, Metrics Explorer shows how those numbers moved over time — useful for spotting trends, traffic spikes, or a gradual creep in agent latency that a single snapshot wouldn't reveal.
Layout
Like Consolidated Stats, the dialog splits into a scope on the left and the actual chart plus its controls on the right — though here there's only one view on the right (the timeline chart), not several tabs.
Scope (left-hand vertical nav): either All Environments — every environment's numbers summed together into one timeline — or one entry per individual environment, scoping the whole chart down to that environment alone. Whichever is selected, every control described below (metrics, time range, aggregation, resolution) applies to that same scope; switching scope re-fetches and redraws the chart for the newly-selected environment(s) without resetting any of your other choices.
Selecting Metrics
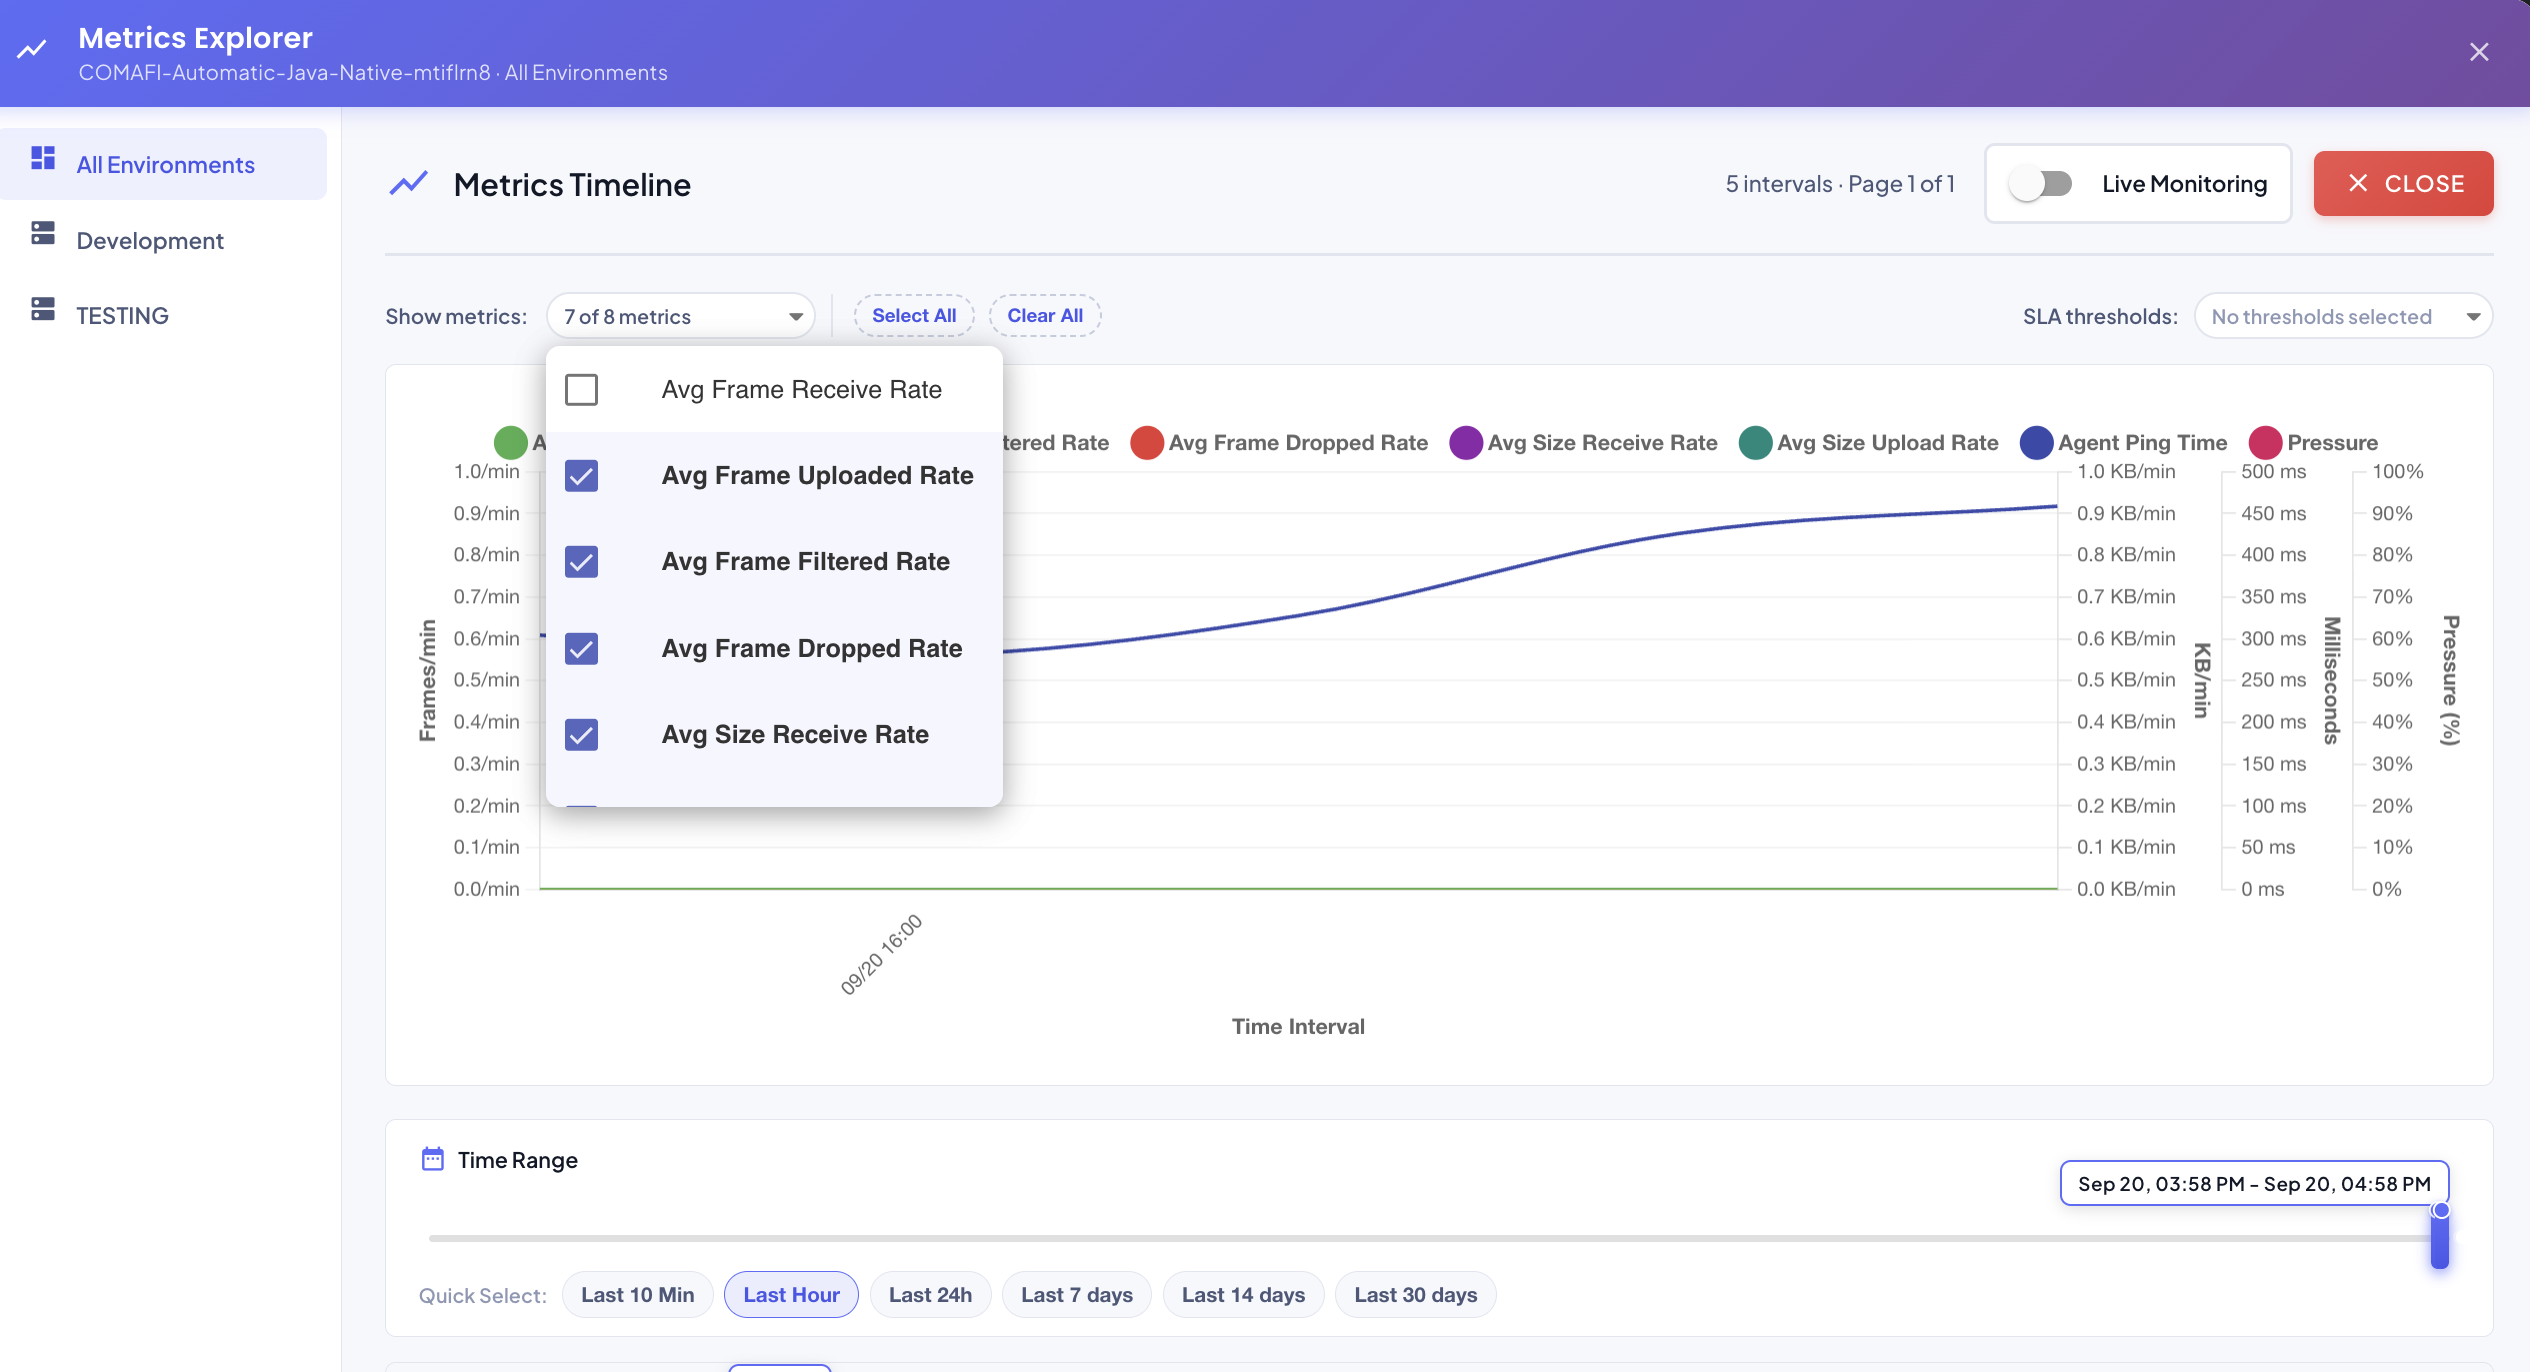
The Show metrics dropdown lets you pick which dimensions actually get plotted:
| Dimension | What it measures | Axis |
|---|---|---|
| Avg Frame Receive Rate | Frames captured per minute, averaged over the interval. | Frames/min |
| Avg Frame Uploaded Rate | Frames successfully uploaded per minute, averaged over the interval. | Frames/min |
| Avg Frame Filtered Rate | Frames filtered out by configuration per minute, averaged over the interval. | Frames/min |
| Avg Frame Dropped Rate | Frames dropped (buffer overflow, upload failure) per minute, averaged over the interval. | Frames/min |
| Avg Size Receive Rate | Payload data received per minute, averaged over the interval. | KB/min |
| Avg Size Upload Rate | Payload data uploaded per minute, averaged over the interval. | KB/min |
| Agent Ping Time | Average round-trip time of /heartbeat calls to the Agent, per interval. | Milliseconds |
| Pressure | Buffer occupancy (frames buffered ÷ Buffer Max Size), per interval — the same metric behind the Pressure Alert. | Pressure (%) |
Rates, not running totals
Every frame/size dimension here is a rate (per minute), not a cumulative count — it shows how fast things were moving during each interval, which is what actually reveals a trend or a spike. For the running totals since an environment first started, see Lifetime Totals in Consolidated Stats instead.
Avg Frame Receive Rate and Avg Frame Uploaded Rate are checked by default; the rest are one click away. The dropdown's own label summarizes the current selection ("All metrics", "7 of 8 metrics", etc.), and Select All / Clear All next to it toggle every dimension at once. Each checked dimension gets its own color-coded line on the chart, plotted against whichever of the four axes (Frames/min, KB/min, Milliseconds, Pressure %) applies to it — only the axes with at least one checked dimension are actually shown.
Agent Ping Time can show gaps
A time bucket where an environment had nothing to check yet (no Agent configured for that cycle) is excluded from the average rather than counted as an instant 0ms — so the Agent Ping Time line may show gaps that the frame/byte dimensions don't, instead of dipping to zero.
SLA Threshold Overlays
To the right of Show metrics, an SLA thresholds dropdown overlays this interceptor's own SLA breach thresholds — Pressure and Agent Latency, the same two metrics configured on the Edit dialog's SLAs tab — directly onto the chart:
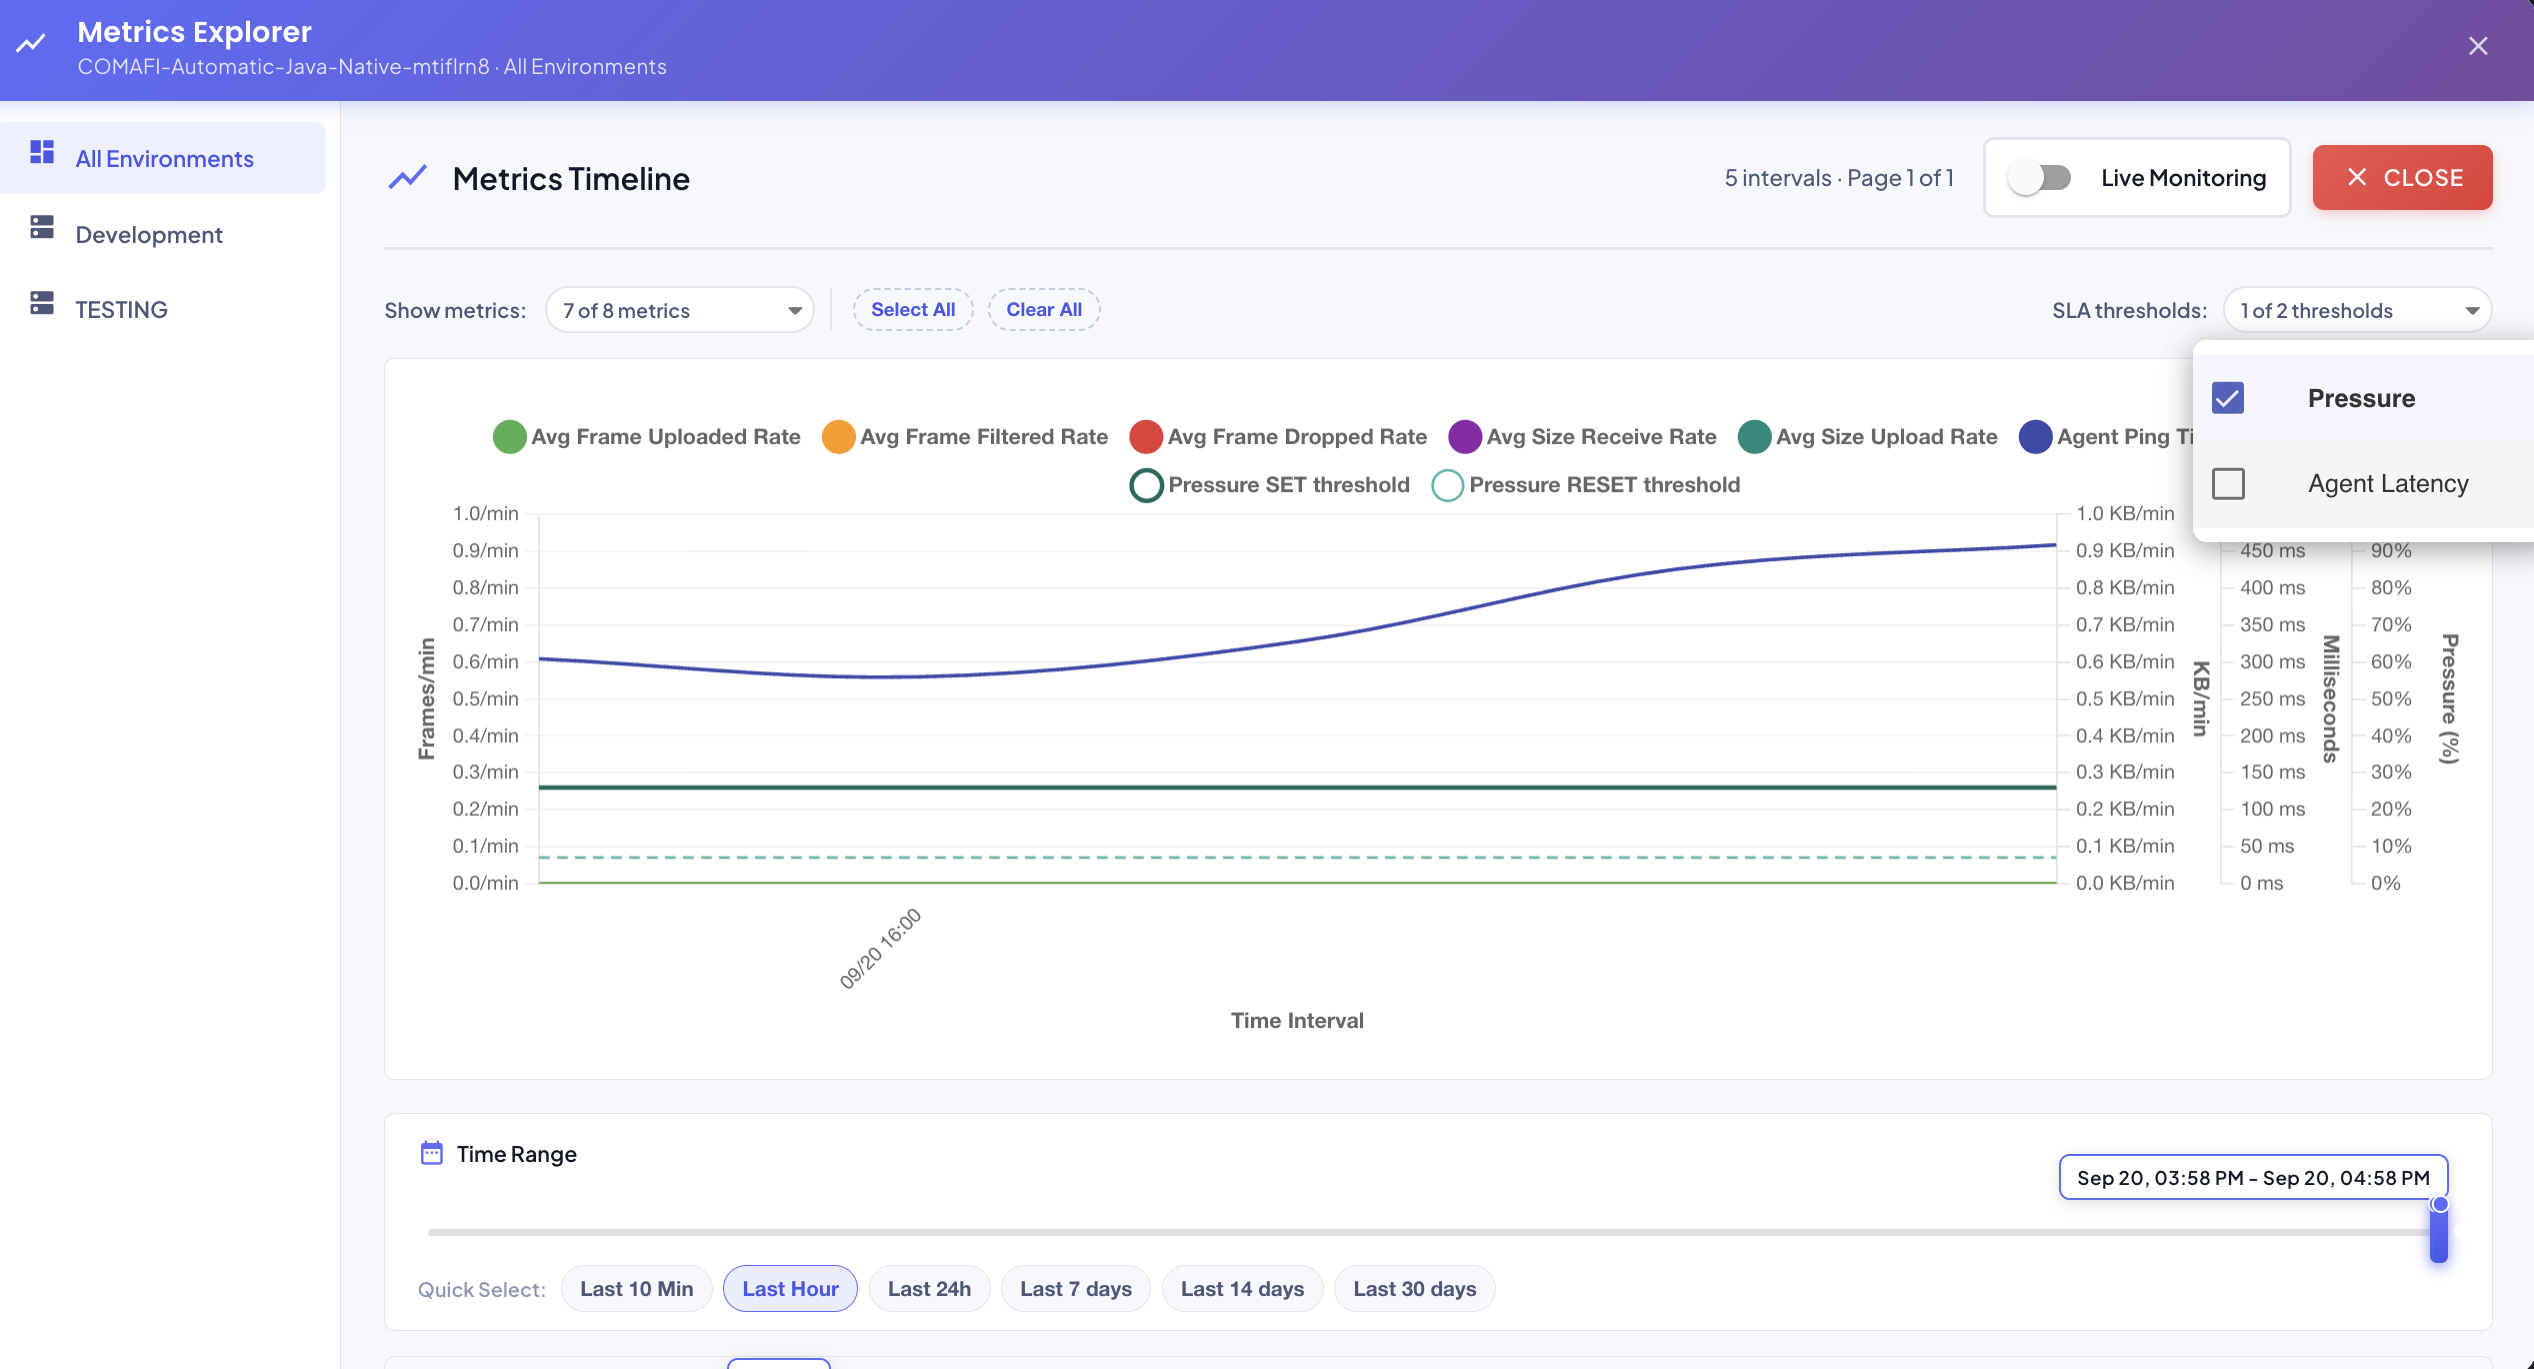
Checking a metric here draws its thresholds as two horizontal reference lines:
- SET threshold — a solid line marking the level above which the SLA breach condition triggers.
- RESET threshold — a dashed line marking the level below which an active breach clears.
Both lines are color-coded to match the metric they belong to (independent of that metric's own line color, so the overlay reads as its own thing rather than a second copy of the main series), and labelled inline at the chart's right edge.
Availability
Only metrics with SLA monitoring actually enabled appear as checkboxes here — if neither Pressure nor Agent Latency has its SLA turned on, the whole SLA thresholds dropdown is grayed out (nothing to select). A metric's threshold overlay also only renders while that same metric is checked in Show metrics: hiding Pressure from the chart hides its threshold lines along with it, even if still checked here.
Live Monitoring
Switch on the Live Monitoring toggle (top right) to turn the chart into a rolling real-time view instead of a fixed historical window:
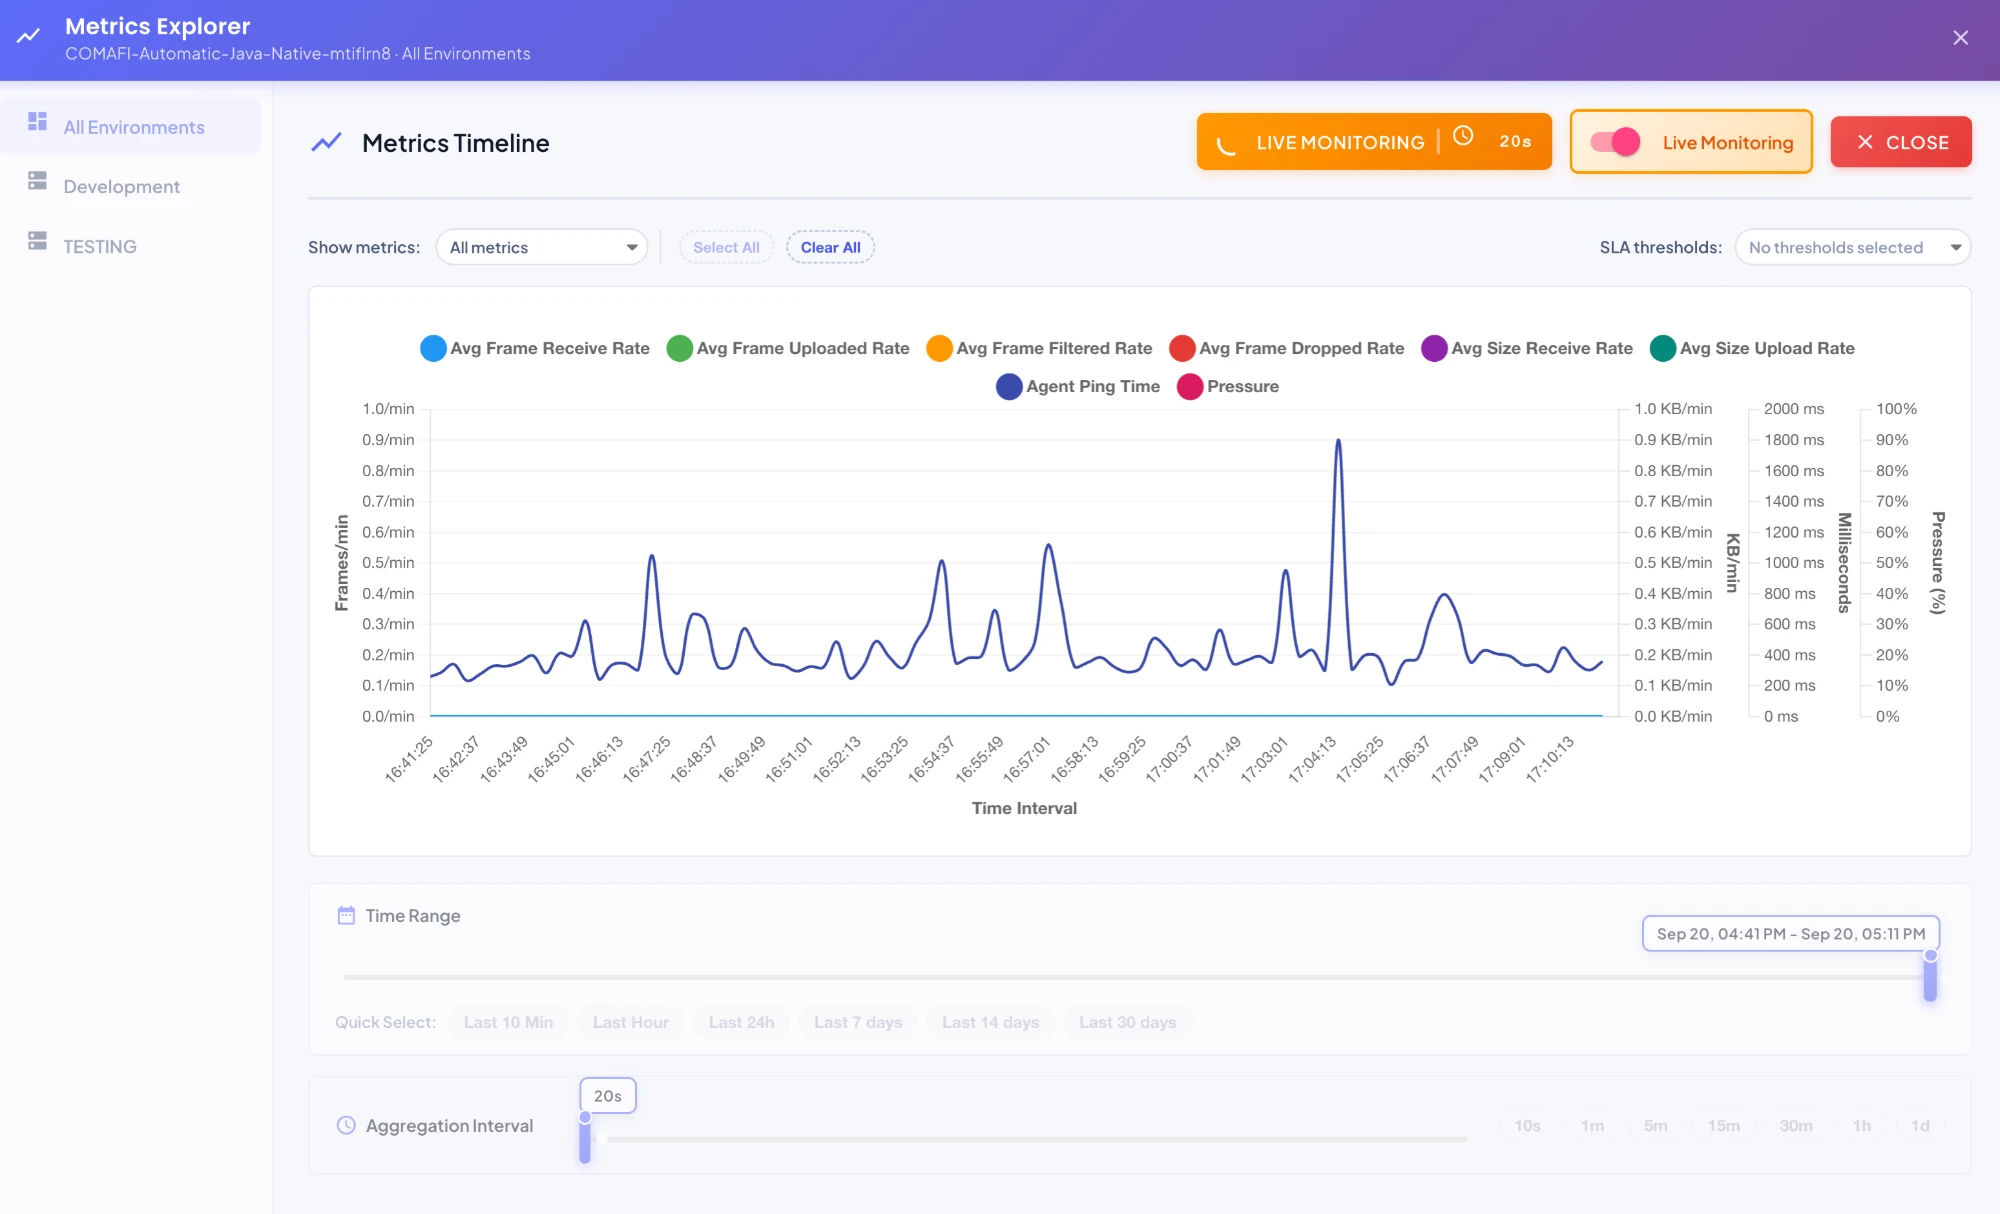
- A LIVE MONITORING | \<Ns> pill appears, showing the current auto-refresh interval — the chart re-fetches and redraws on that cadence for as long as Live Monitoring stays on.
- Time Range and its Quick Select presets are disabled while Live Monitoring is on — the window is managed automatically (a fixed span ending at "now") instead of something you set yourself. Turn Live Monitoring back off to regain manual control over the time range.
- Everything else — dimension selection, Environment Scope, Aggregation Interval — keeps working exactly as it does outside Live Monitoring, and each new fetch respects whatever's currently selected there.
Turn Live Monitoring on when actively watching an interceptor react to something happening right now (e.g. a traffic spike, or Pressure climbing under load) — leave it off for after-the-fact analysis of a specific past window.
Time Range
Sets the window of history the chart covers — two equivalent ways to set it:

- Drag the slider's two handles — the left one moves the start of the window, the right one moves the end. The exact resulting window (e.g.
Aug 29, 08:01 PM – Aug 29, 08:11 PM) is shown above the slider as you adjust it. - Click a Quick Select preset — Last 10 Min, Last Hour, Last 24h, Last 7 days, Last 14 days, or Last 30 days — snaps the slider to that exact window ending at now, in one click, without needing to drag anything by hand.
Aggregation Interval
Controls how much time each single point on the chart represents — every sync that lands within one interval gets folded into one point, rather than plotting every individual sync separately. Two equivalent ways to set it, same pattern as Time Range:

- Drag the slider to any value between 10 seconds and 1 day.
- Click a preset button — 10s, 1m, 5m, 15m, 30m, 1h, or 1d — to jump straight to that exact interval.
Each bucket's value is the average of every sync that landed in it, alongside its max and min (surfaced on hover).
How Time Range Affects Which Preset Buttons Are Enabled
The preset buttons aren't all clickable at once — only the intervals that actually make sense for the currently-selected Time Range are enabled, in both directions:
- Too coarse, relative to a short range, is disabled. With Last 10 Min selected, 10s, 1m, and 5m are enabled, while 15m, 30m, 1h, and 1d are grayed out — a 15-minute bucket is already wider than the entire 10-minute window being charted, so it couldn't produce more than a single, largely meaningless point.
- Too fine, relative to a long range, is disabled the same way. A multi-day or multi-week Time Range disables the very fine intervals (e.g. 10s) at the other end — charting 30 days of history in 10-second buckets would mean an unusable number of points, so the platform doesn't offer it.
In short: whichever presets remain enabled are simply the ones that would actually produce a sane, readable number of points for the range you've currently got selected. Widening or narrowing the Time Range re-evaluates which presets are enabled every time.
Resolution and Pagination
Resolution controls how many data points render per page (15, 30, 45, or 60) — independent of both Time Range and Aggregation Interval, this is purely about how densely-packed a single page of the chart looks.
A wide Time Range charted at a fine Aggregation Interval can produce more points than even the largest Resolution fits on one page — when that happens, use the pagination controls in the bottom-right to move through the full result set page by page:

| Control | Action |
|---|---|
| Jump to the first page. | |
| Go back one page. | |
| Page X of Y | Current page position — Y is however many pages the current Resolution splits the full point count into. |
| Go forward one page. | |
| Jump to the last page. |
All four buttons are disabled together whenever the current result fits entirely on one page (Page 1 of 1) — there's nowhere else to page to.