Interceptor Alerts
Independent of an environment's four states, it can also be flagging one or more alerts — a separate, overlaid signal about whether that environment's traffic is actually healthy, not whether it's connected. An environment can be Online and still be under a Pressure Alert, failing to upload, or waiting on a restart, all at once — being Online just means it's capturing and uploading traffic right now, not that everything about it is fine.
This page covers every kind of alert shown in the platform: Pressure Alert, Agent Latency Alert, Upload Failing, and Restart Required.
Pressure Alert
Configured per-interceptor on the SLAs tab of the Edit dialog, under its Pressure sub-tab. Pressure is the interceptor's own buffer occupancy (frames buffered ÷ Buffer Max Size, as a percentage) — a rising trend under sustained load, and a strong warning sign once it starts holding near 100%, since a completely full buffer starts silently dropping newly-captured frames instead of queuing them. It's shown as its own Avg Pressure column and tile throughout Consolidated Stats regardless of whether alerting is even enabled for it — the alert is just what fires once the configured Set threshold is breached for the configured Set Time, and clears automatically once pressure drops back to (and stays at) the configured Reset threshold for the configured Reset Time — no manual acknowledgement needed.
When triggered, the alert shows up in three places at once:
-
The Alerts column in Consolidated Stats' Environments table gets a colored icon () in place of the default gray checkmark — hovering it shows exactly when the breach started. The exact same icon-plus-hover pattern is reused for Agent Latency Alert, Upload Failing, and Restart Required below, just with their own icon and message.
-
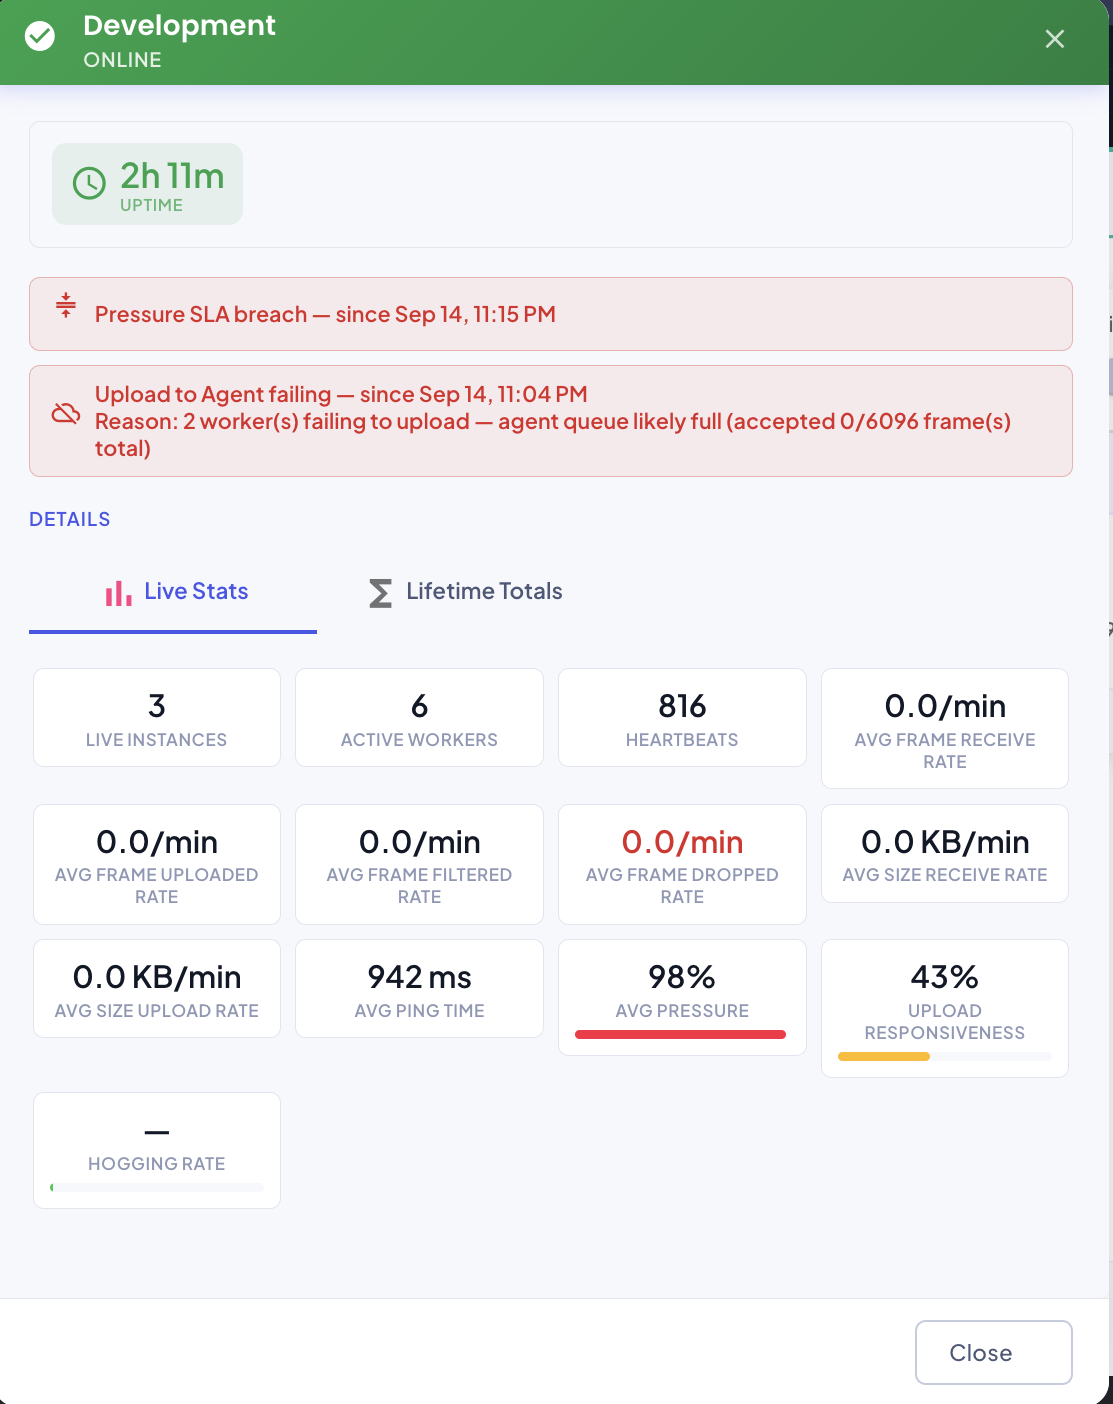
The environment detail dialog (Environment Status — click an environment's status dot to open it) shows a full-width red banner above the Live Stats/Lifetime Totals tabs, naming the metric and the exact breach start time — more than one can stack at once if multiple conditions are active simultaneously:
-
If Alerting is also enabled and configured with recipients, a notification goes out over the configured channel(s) (Email and/or SMS) — and is also logged as a platform notification, viewable from the icon in the header bar:
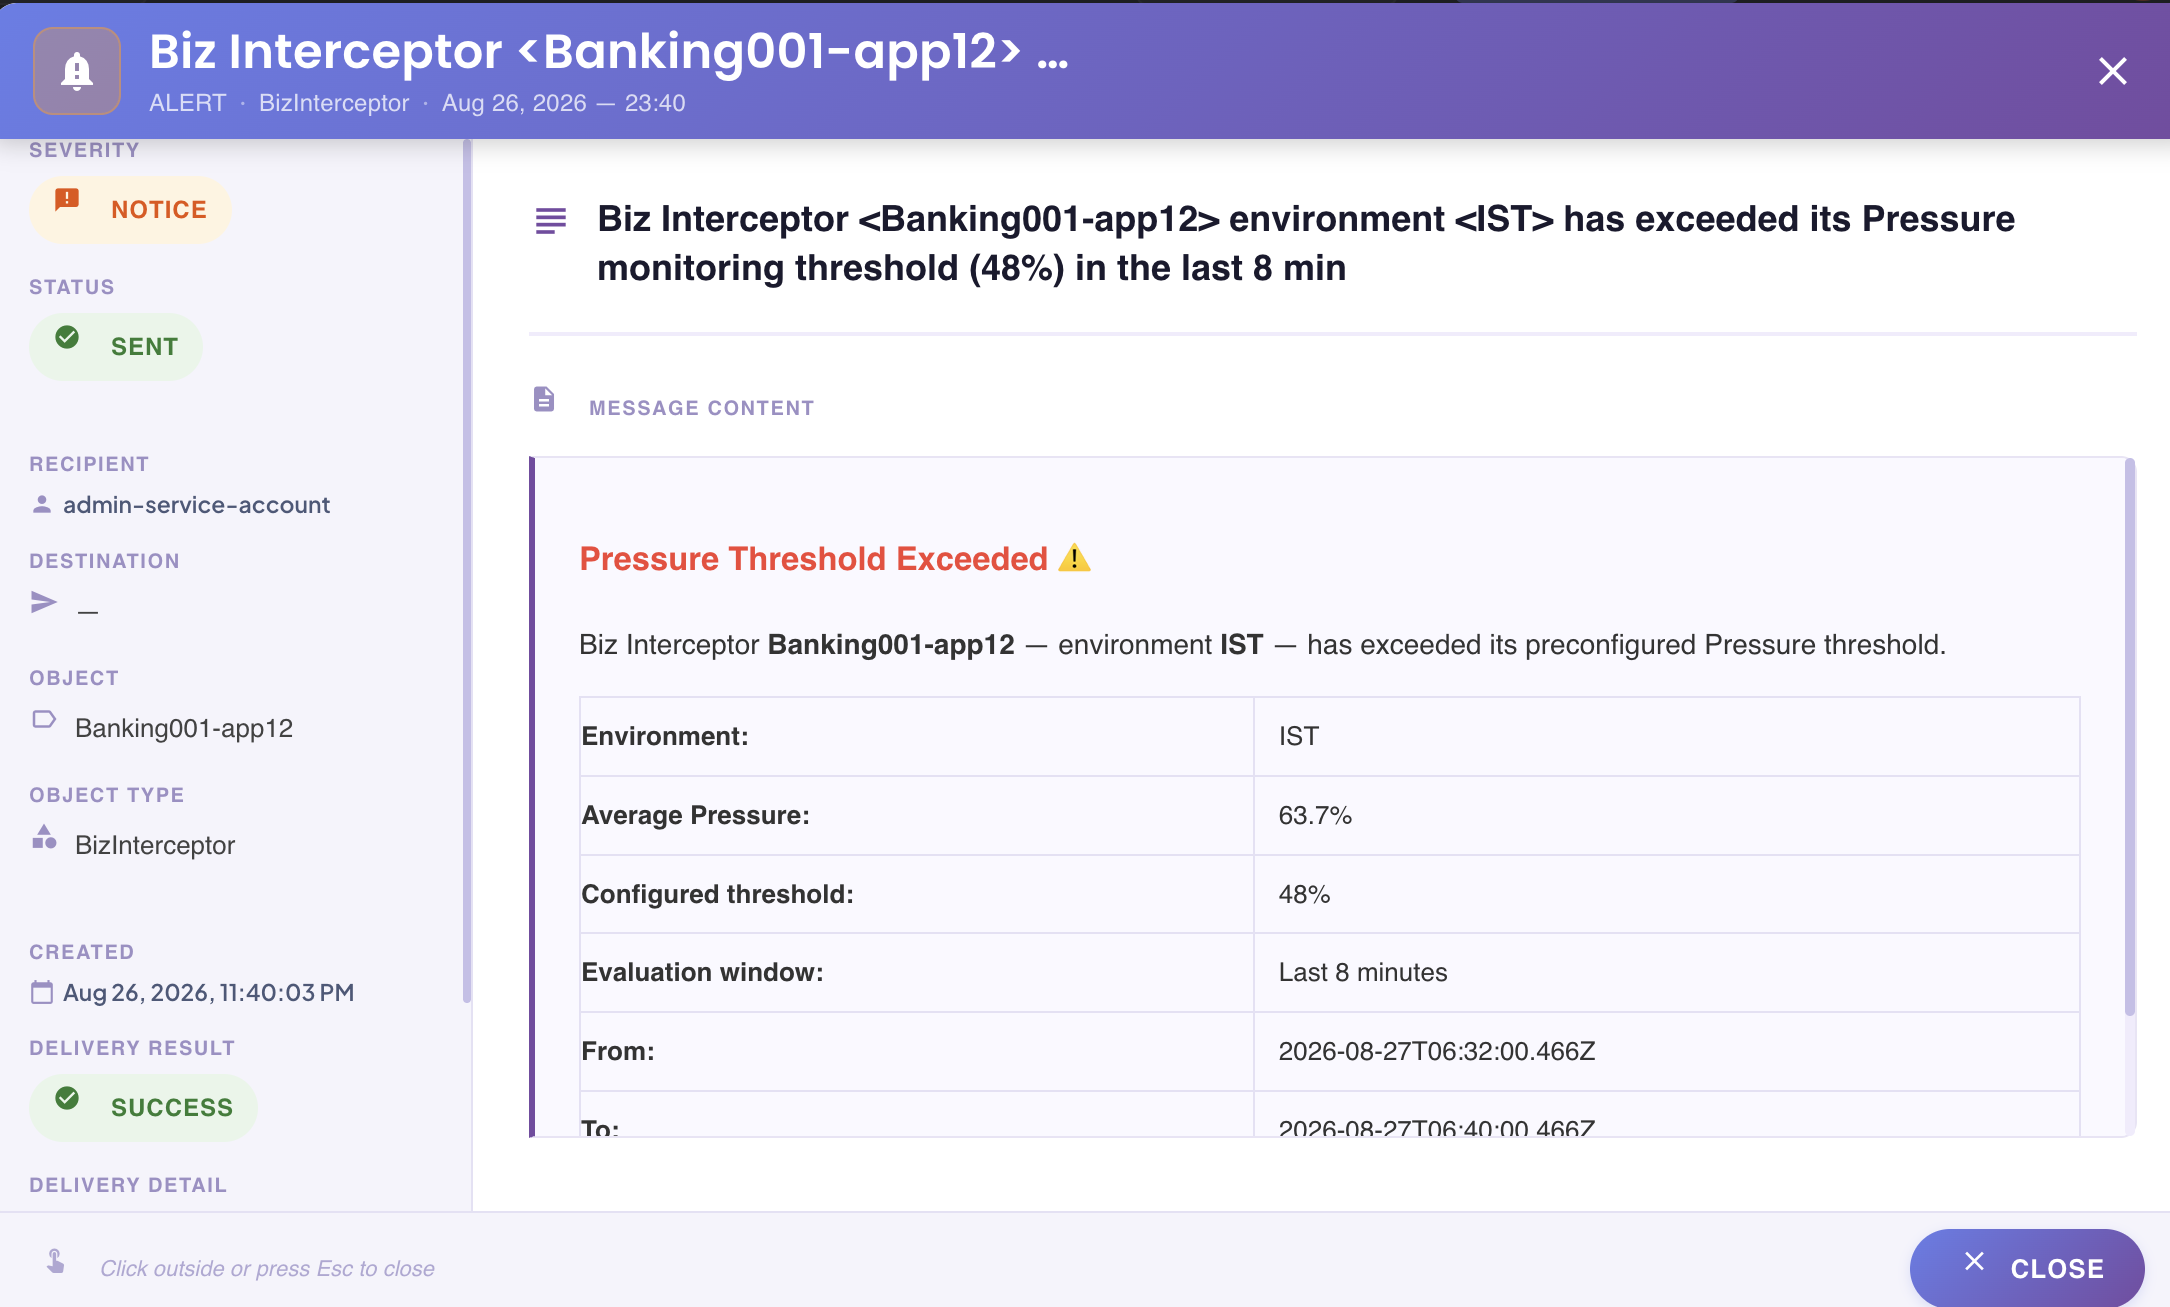
The notification names the interceptor and environment, the metric that breached (Average Pressure), its actual value at the time, the configured threshold it crossed, and the evaluation window used to decide the breach was sustained rather than a momentary spike.
Agent Latency Alert
Configured the same way as Pressure Alert above, on the same SLAs tab, under its Agent Latency sub-tab instead — same Set/Set Time/Reset/Reset Time controls, just against a different metric. Agent Latency is the round-trip time of the interceptor's calls to its environment's Agent, shown as its own Avg Ping column and tile throughout Consolidated Stats regardless of whether alerting is enabled for it.
It uses the exact same icon-plus-hover pattern in the Alerts column as Pressure Alert, on its own icon — hovering it shows exactly when the breach started:
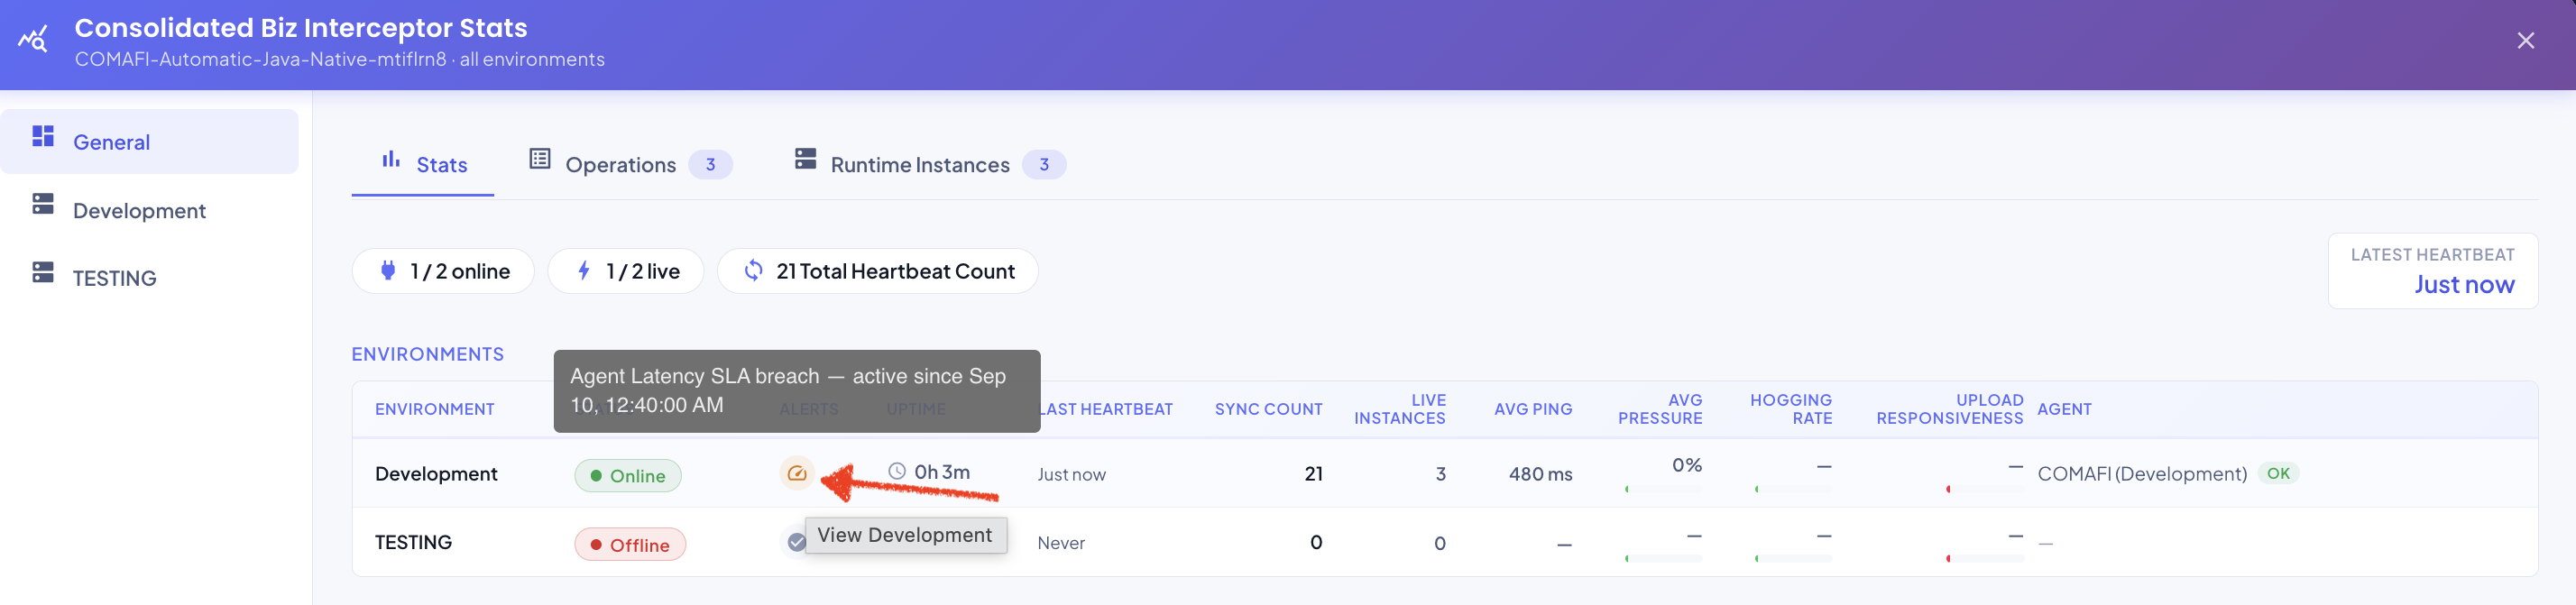
The same environment-detail-dialog banner and notification pattern described under Pressure Alert above applies here too, just naming Average Ping Time as the breached metric instead of Average Pressure.
Solid vs. blinking green status dot
A Pressure or Agent Latency alert is also what turns an environment's Online status dot from solid to blinking green in the Biz Interceptor Summary table — same underlying Online status, just flagged as worth a look.
Upload Failing
Unlike Pressure and Agent Latency above, Upload Failing isn't a configurable threshold — it's a direct, binary signal: is this environment's traffic currently making it to the Agent, or not? It fires whenever at least one runtime instance's own upload attempts are failing (most commonly the Agent's own queue being full, but any upload error qualifies), and clears the moment uploads start succeeding again.
It uses the exact same icon-plus-hover-tooltip pattern as Pressure/Agent Latency, on its own icon in the Alerts column — hovering it shows since when it's been failing and why:
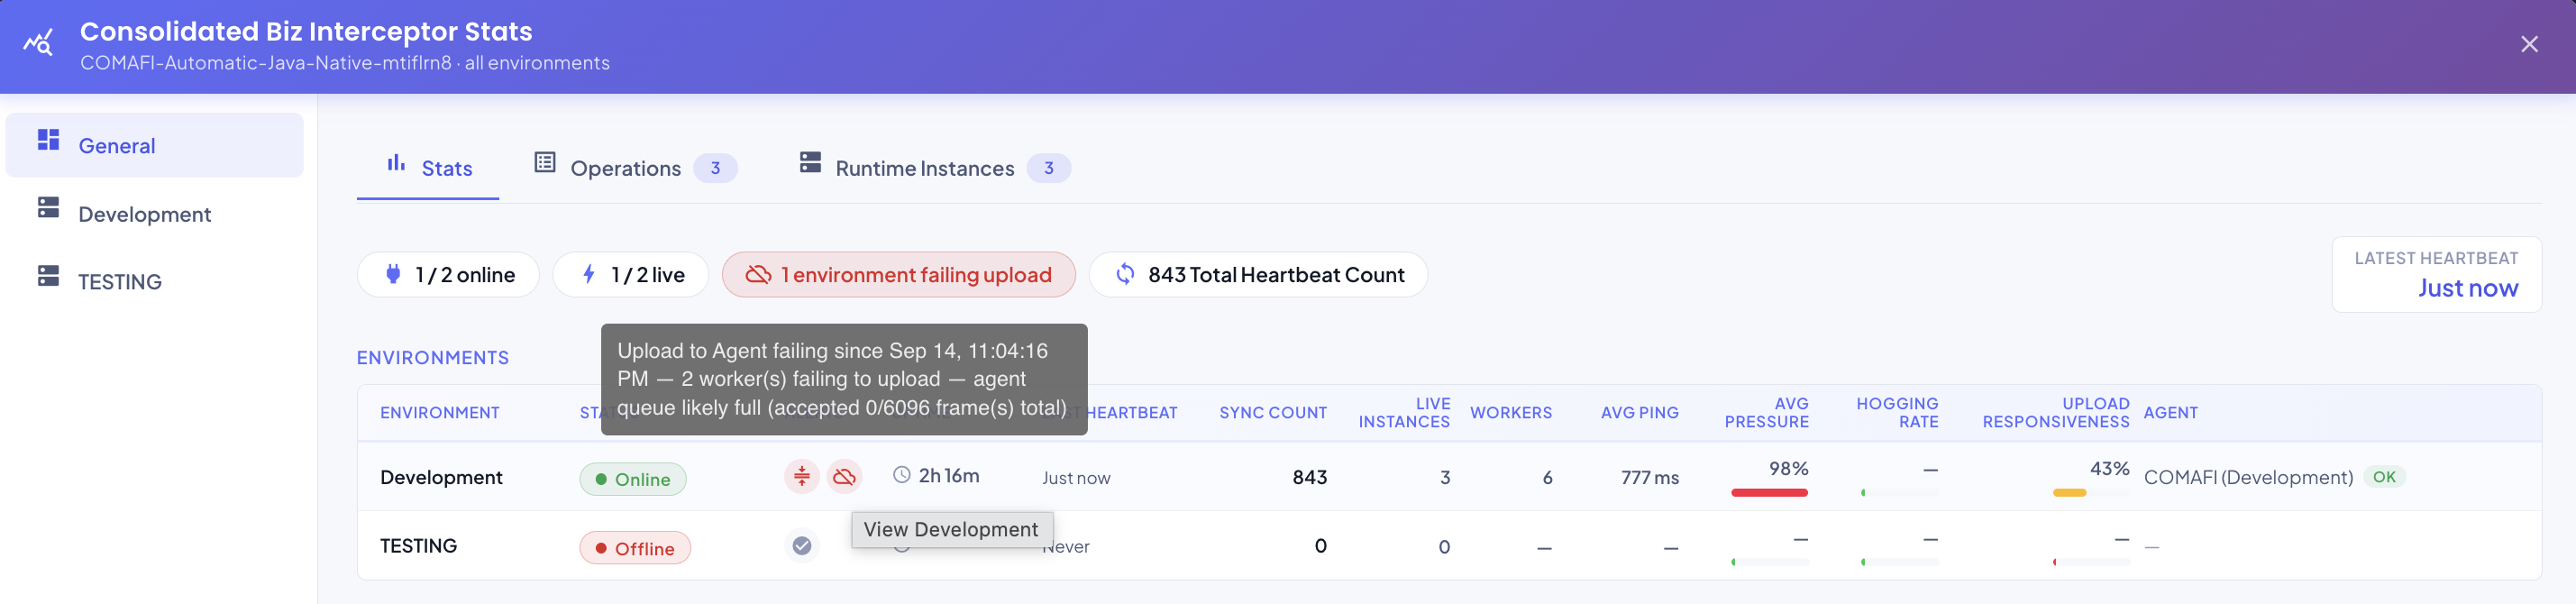
A N environment(s) failing upload summary badge appears at the top of Consolidated Stats' General scope whenever at least one environment is affected, the same way Restart Required below gets its own summary badge.
This is active data loss, not just a delay
Once an environment's buffer fills up while it can't upload, newly-captured frames start getting dropped instead of queued — see Pressure Alert above. Traffic dropped this way is permanently lost, not delayed, and degrades the precision of every downstream KPI and dashboard calculation built on it. Upload Failing is worth treating as urgent, not something to let self-resolve.
Restart Required
A Requires Restart condition means a configuration change made through the Edit dialog (most commonly a Buffer Max Size change) couldn't be hot-applied to one or more of an environment's already-running instances — those specific processes need an actual restart to pick it up. Like the alerts above, this is layered independently on top of the four-state status: an environment can be Online and Requires-Restart at the same time.
Why some changes need a restart
Not every interceptor configuration change can be applied while it's running. In particular, any change made under the Edit dialog's Tuning tab for a given environment requires an actual restart of that environment's affected interceptor instances before it takes effect — there's no hot-deploy path for these, only a cold restart.
A restart here means restarting the business application
An interceptor doesn't run as a standalone process — by definition, it lives embedded inside the business application it instruments. Restarting the interceptor therefore means restarting that application, which ties any interceptor-level configuration change to the application's own deployment/rollout windows rather than something the platform can apply on its own schedule.
For this reason, interceptor-level changes should generally be planned the same way an application deployment would be, so they don't impact business continuity — this matters most in higher environments like UAT and Production, where an unplanned restart carries real cost.
Same icon-plus-hover pattern again, this time on an exclamation-mark icon, naming exactly what changed:
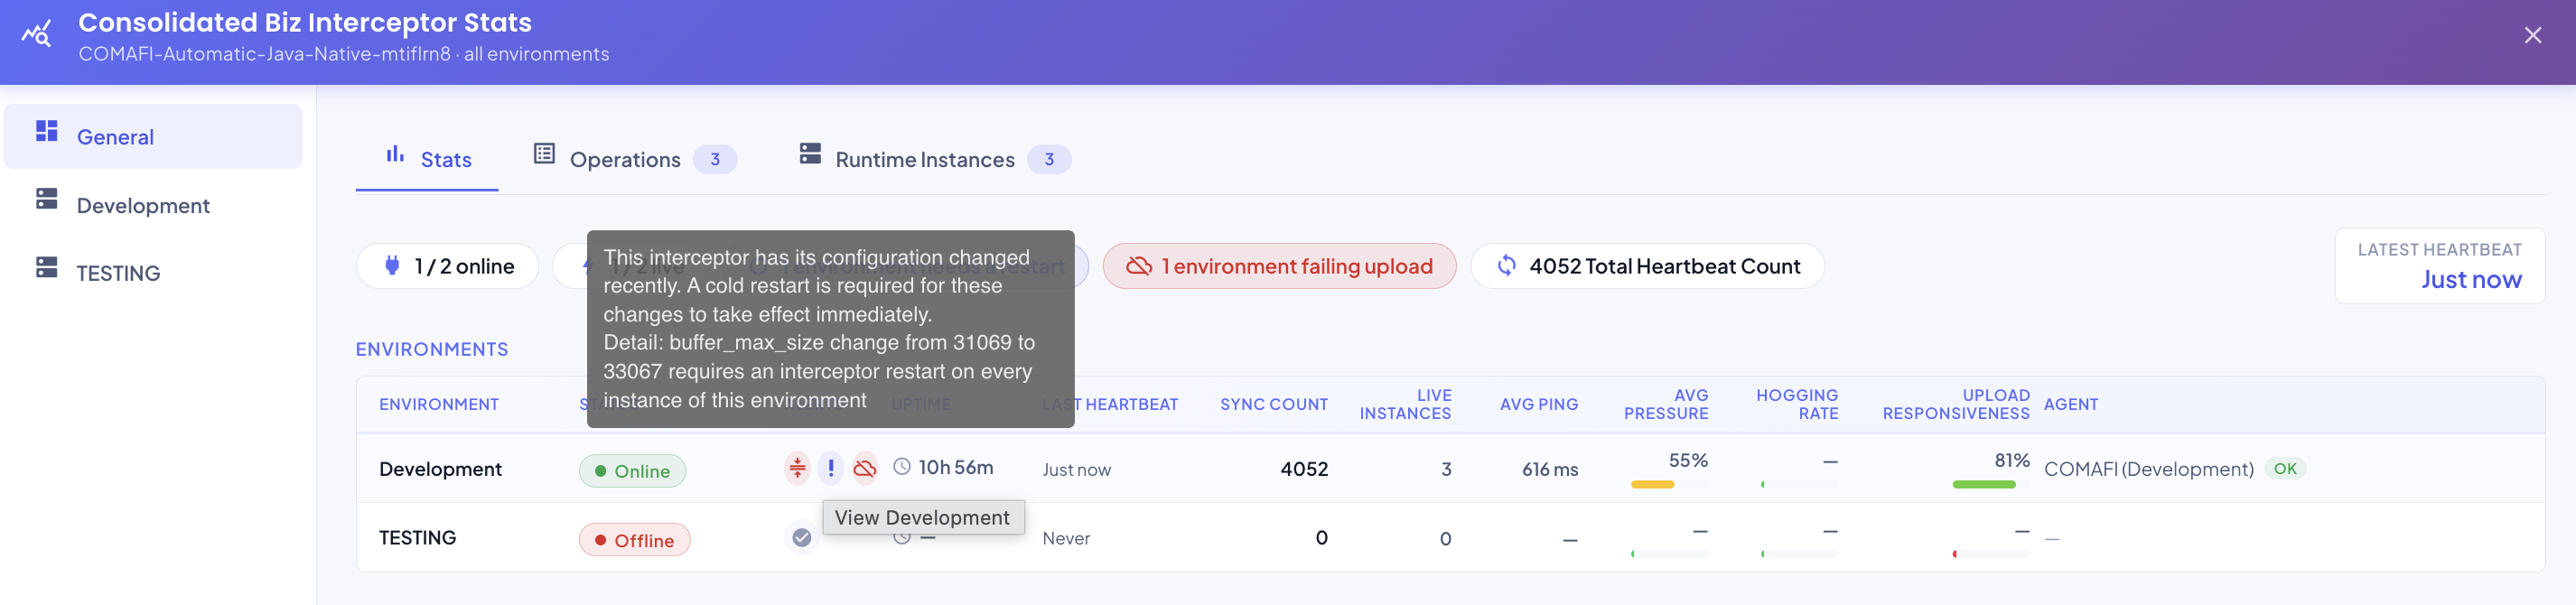
The environment detail dialog shows the same information as a blue informational banner above the Live Stats/Lifetime Totals tabs.
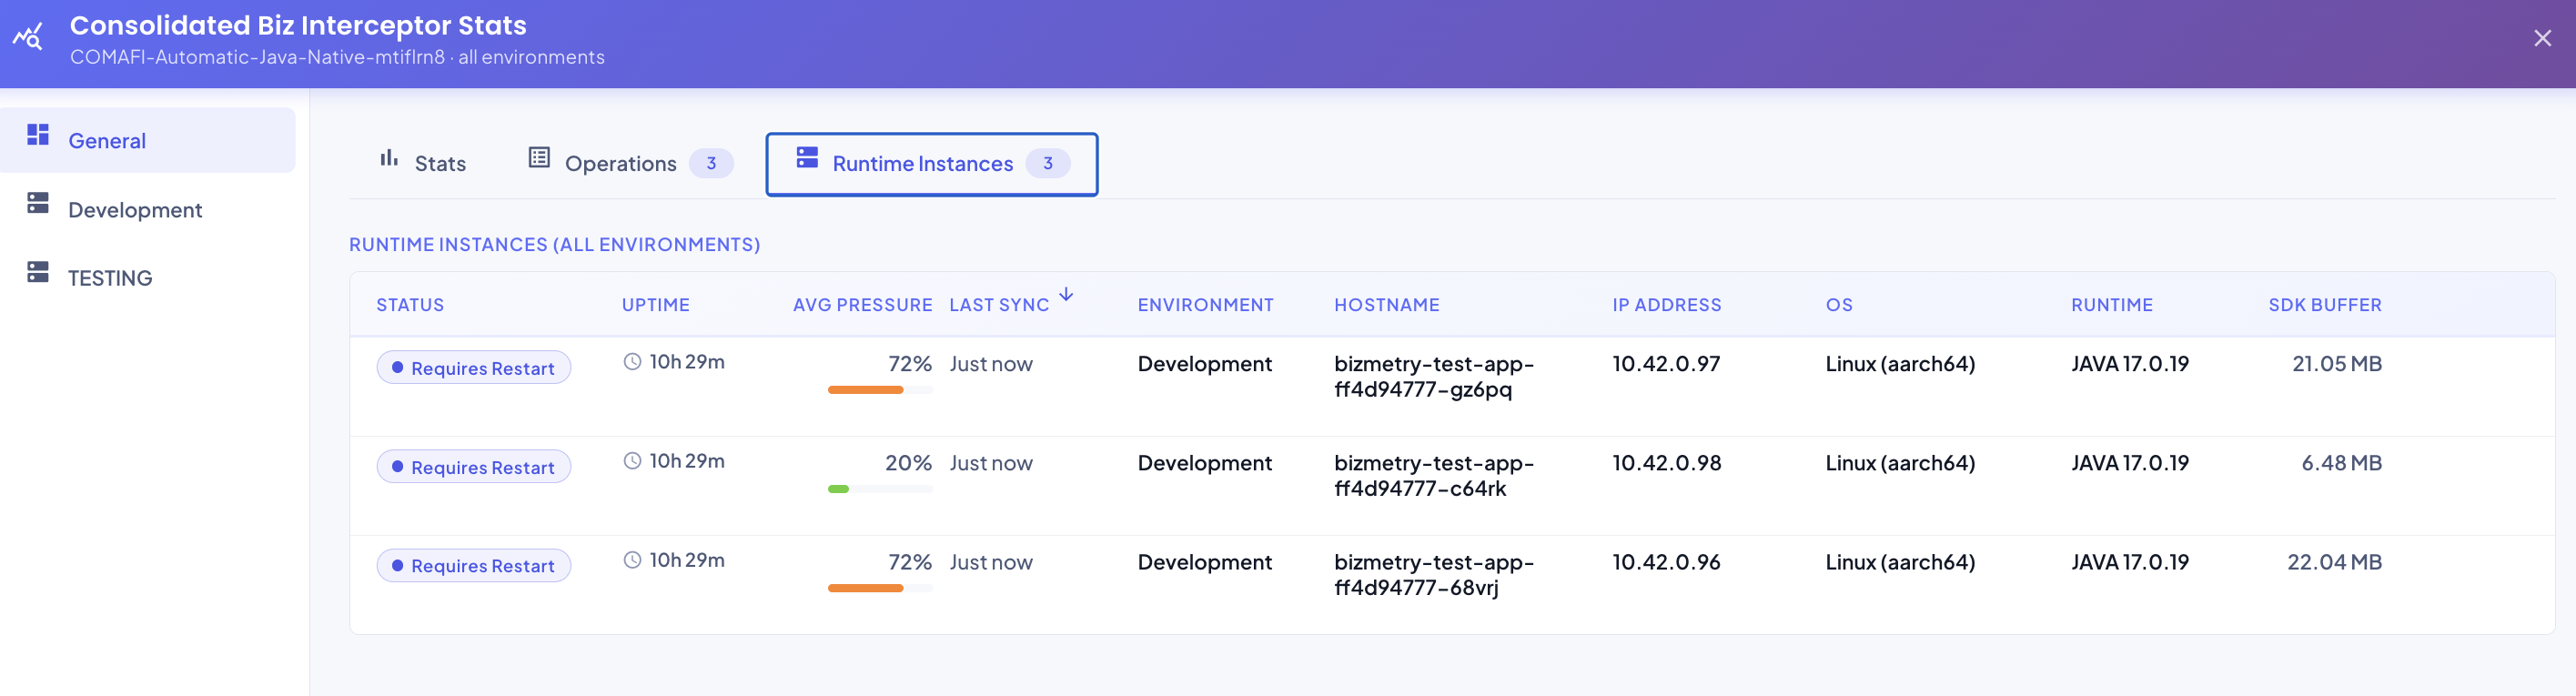
It surfaces per-instance too, in Consolidated Stats' Runtime Instances table, where any instance still running the old configuration shows a Requires Restart status badge instead of Running — restarting just that specific process (a pod restart, in a Kubernetes-deployed interceptor) clears it for that instance once it comes back up and re-reads its configuration: