Environment Status
Every environment a Biz Interceptor is enabled for is, at any moment, in exactly one of four states — shown as a colored, clickable dot in the Biz Interceptor Summary table, and reused throughout Consolidated Stats.
This page covers what each state means, what you see hovering over its dot, and what you see clicking it.
The Four States
| Dot | Status | Meaning |
|---|---|---|
| (solid) | Online | Heartbeating and actually live — this environment is capturing and uploading traffic right now, with nothing needing attention. |
| (blinking) | Online, with alerts | Same as Online — heartbeating and live — but one or more Pressure Alert/Agent Latency Alert conditions are currently active for this environment. Still fundamentally healthy connectivity-wise; the blink is what tells you not to stop looking here. Click the dot the same as any other to see exactly which alert(s) are active and their details. |
| (pulsing) | Standby | Heartbeating — raw connectivity to the platform is fine — but not live, for a reason unrelated to connectivity (see Why Standby? below). |
| (pulsing) | Unreachable | Heartbeating to the platform, but this specific interceptor's own local reachability check to its Agent is failing. |
| (static) | Offline | No heartbeat received within the expected window. |
DEV01 (red, Offline) and IST (green, Online) on the same interceptor, in the Biz Interceptor Summary table:
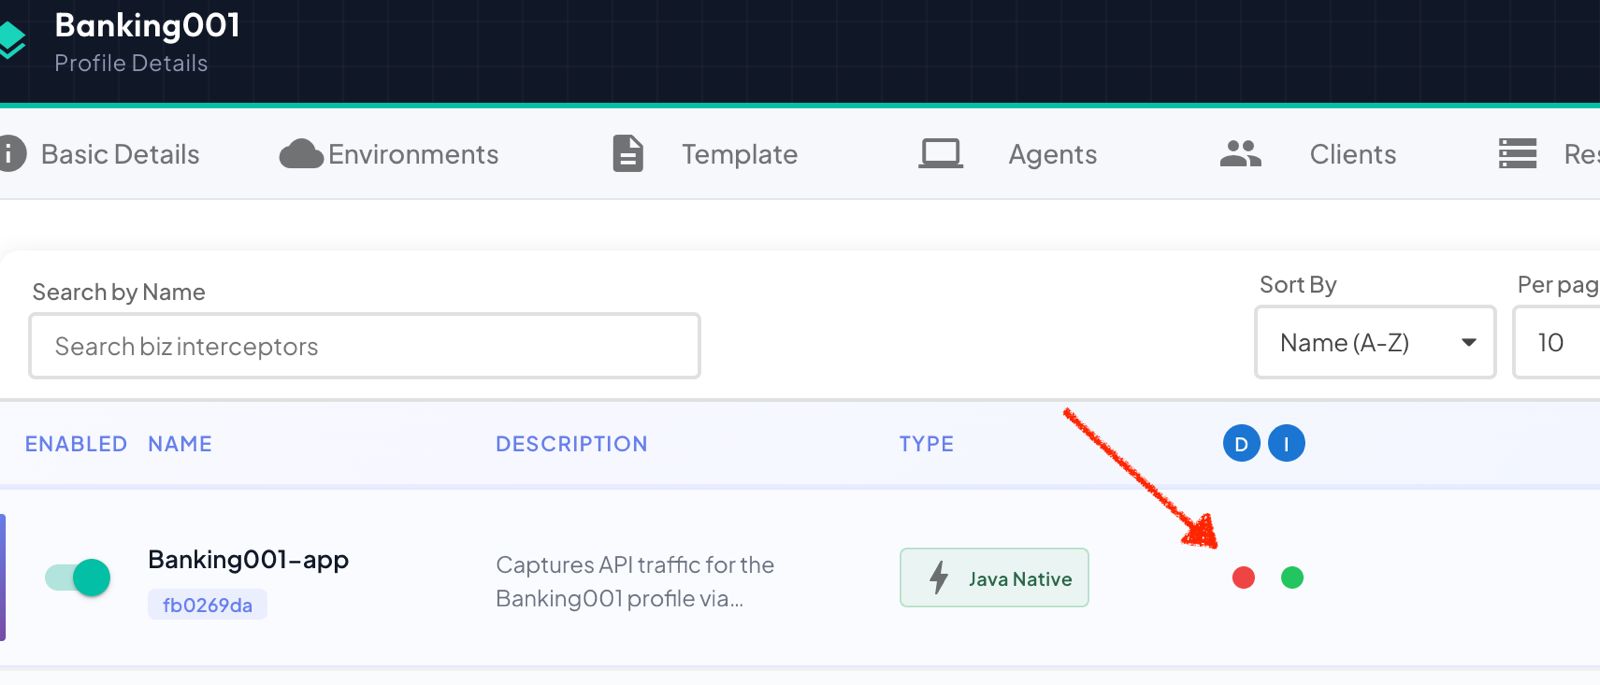
Solid vs. blinking green is about alerts, not connectivity
Both are the same Online status underneath — an environment doesn't become "more" or "less" online because an alert is active. The blink is purely a visual flag that something (Pressure, Agent Latency, or both) has crossed its configured threshold and is worth a look, layered on top of a status that's otherwise perfectly healthy.
Why the distinction matters
A naive "is it heartbeating" check would only ever show two states (Online/Offline) — but a heartbeating interceptor isn't necessarily doing anything. STANDBY and UNREACHABLE exist to surface exactly that gap:
- Standby catches every reason an interceptor might be heartbeating but not actually live: the interceptor itself disabled, the Profile disabled, this specific environment disabled (either at the Profile level or for this interceptor specifically), or the environment's Agent not being online.
- Unreachable catches something Standby can't: the Agent's own self-reported health can say it's perfectly fine, while this particular interceptor still can't reach it — a local network, firewall, or DNS problem specific to where the interceptor itself is running. A plain green "heartbeating" dot would hide a real, actionable problem here.
Priority order
An environment can technically match more than one condition at once (e.g. disabled and its Agent down) — when that happens, exactly one status wins, in this order, highest first:
%%{init: {"themeVariables": {"fontSize": "16px"}}}%%
flowchart TB
    A["No heartbeat?"] -->|Yes| OFFLINE["🔴 OFFLINE"]
    A -->|No| B["Disabled somewhere in the chain,\nor its Agent isn't online?"]
    B -->|Yes| STANDBY["🟡 STANDBY"]
    B -->|No| C["This interceptor's own\nAgent reachability check failing?"]
    C -->|Yes| UNREACHABLE["⚫ AGENT_UNREACHABLE"]
    C -->|No| D["Active alerts for this\nenvironment? (Pressure /\nAgent Latency)"]
    D -->|Yes| ONLINE_ALERT["🟢 ONLINE — blinking"]
    D -->|No| ONLINE["🟢 ONLINE — solid"]
No heartbeat at all beats everything else (Offline), then any disabled/Agent-down condition (Standby), then this interceptor's own local reachability check (Unreachable) — only once none of those apply does it come down to Online, and whether it's the solid or blinking variant depends purely on whether an alert happens to be active at that moment.
Why Standby?
When an environment is in Standby, the specific reason (or reasons) are always available — see Clicking a Dot below. The possible reasons are:
- Profile is disabled
- Interceptor is disabled
- This environment is disabled for this interceptor
- The environment itself is disabled
- The environment's agent is not online
More than one can apply simultaneously — e.g. disabling the interceptor as a whole (the master Enabled switch on the Summary row) puts every one of its environments into Standby at once, each showing "Interceptor is disabled" as its reason.
Hovering a Dot
Hovering any environment's status dot shows a tooltip with the environment name, its current status in plain language, and a prompt to click for more:

| Status | Tooltip text |
|---|---|
| Online | <Environment>: Live — click for details |
| Standby | <Environment>: Online, not live — click for details |
| Unreachable | <Environment>: Disconnected from agent — <error> — click for details |
| Offline | <Environment>: Offline — click for details |
For Unreachable specifically, the tooltip includes the actual connection error reported by the interceptor (e.g. a timeout, DNS failure, or TLS handshake error) right inline, not just the status name.
Clicking a Dot
Clicking a dot opens a detail dialog — the header always shows the current status and, below it, one tile with how long the environment has been in that state:
| Status | Duration tile label |
|---|---|
| Online | Uptime — how long the interceptor process has been running continuously (resets only on an actual restart). |
| Standby | In standby for |
| Unreachable | Unreachable for |
| Offline | Offline for |
Below the duration tile, a Details section whose content depends entirely on the current status:
Online
A Details section split into two tabs:
- Live Stats — a grid of capture-rate tiles: Live Instances, Active Workers (total transmit workers currently active across this environment's instances — see Backpressure Auto-Tuning), Heartbeats, Avg Frame Receive Rate, Avg Frame Uploaded Rate, Avg Frame Filtered Rate, Avg Frame Dropped Rate, Avg Size Receive Rate, Avg Size Upload Rate, Avg Ping Time, Avg Pressure, Upload Responsiveness, and Hogging Rate. These answer "how much is happening right now."
- Lifetime Totals — Total Captured, Total Filtered, Total Dropped, Total Bytes Received, Total Bytes Uploaded, alongside a Packet Distribution pie chart (Captured / Filtered / Dropped). These answer "how much has happened since this environment started."
See Rate Metrics vs. Lifetime Totals for the full distinction between the two tabs' worth of metrics, and Consolidated Stats for what each individual tile means.
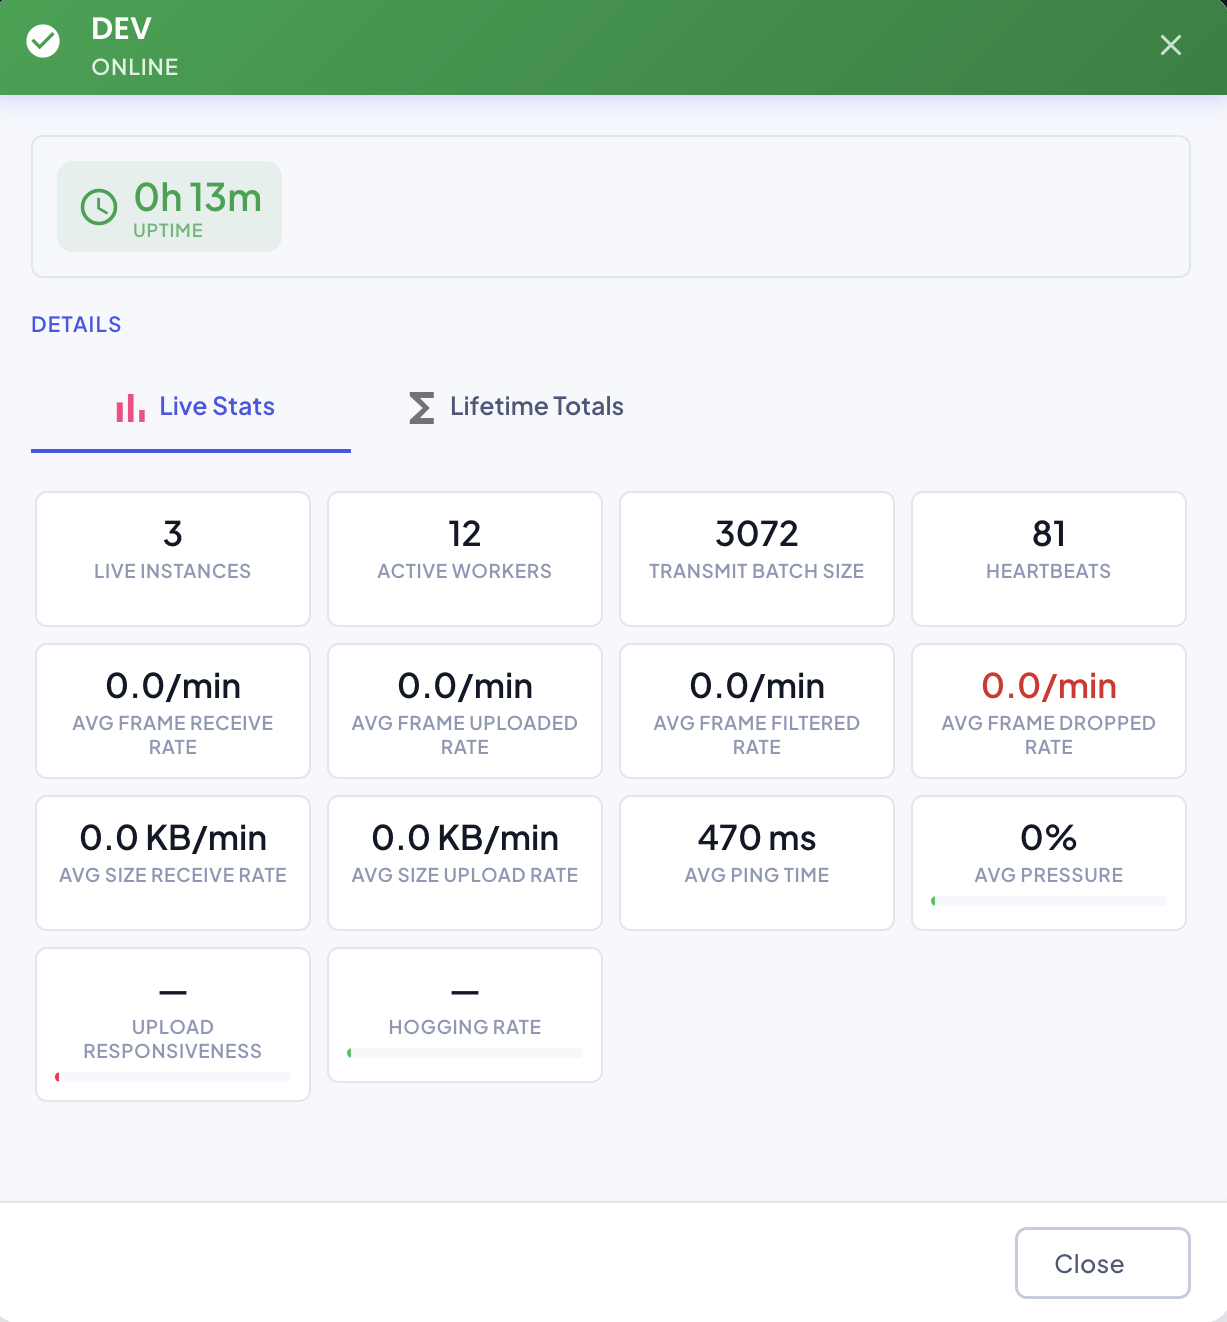
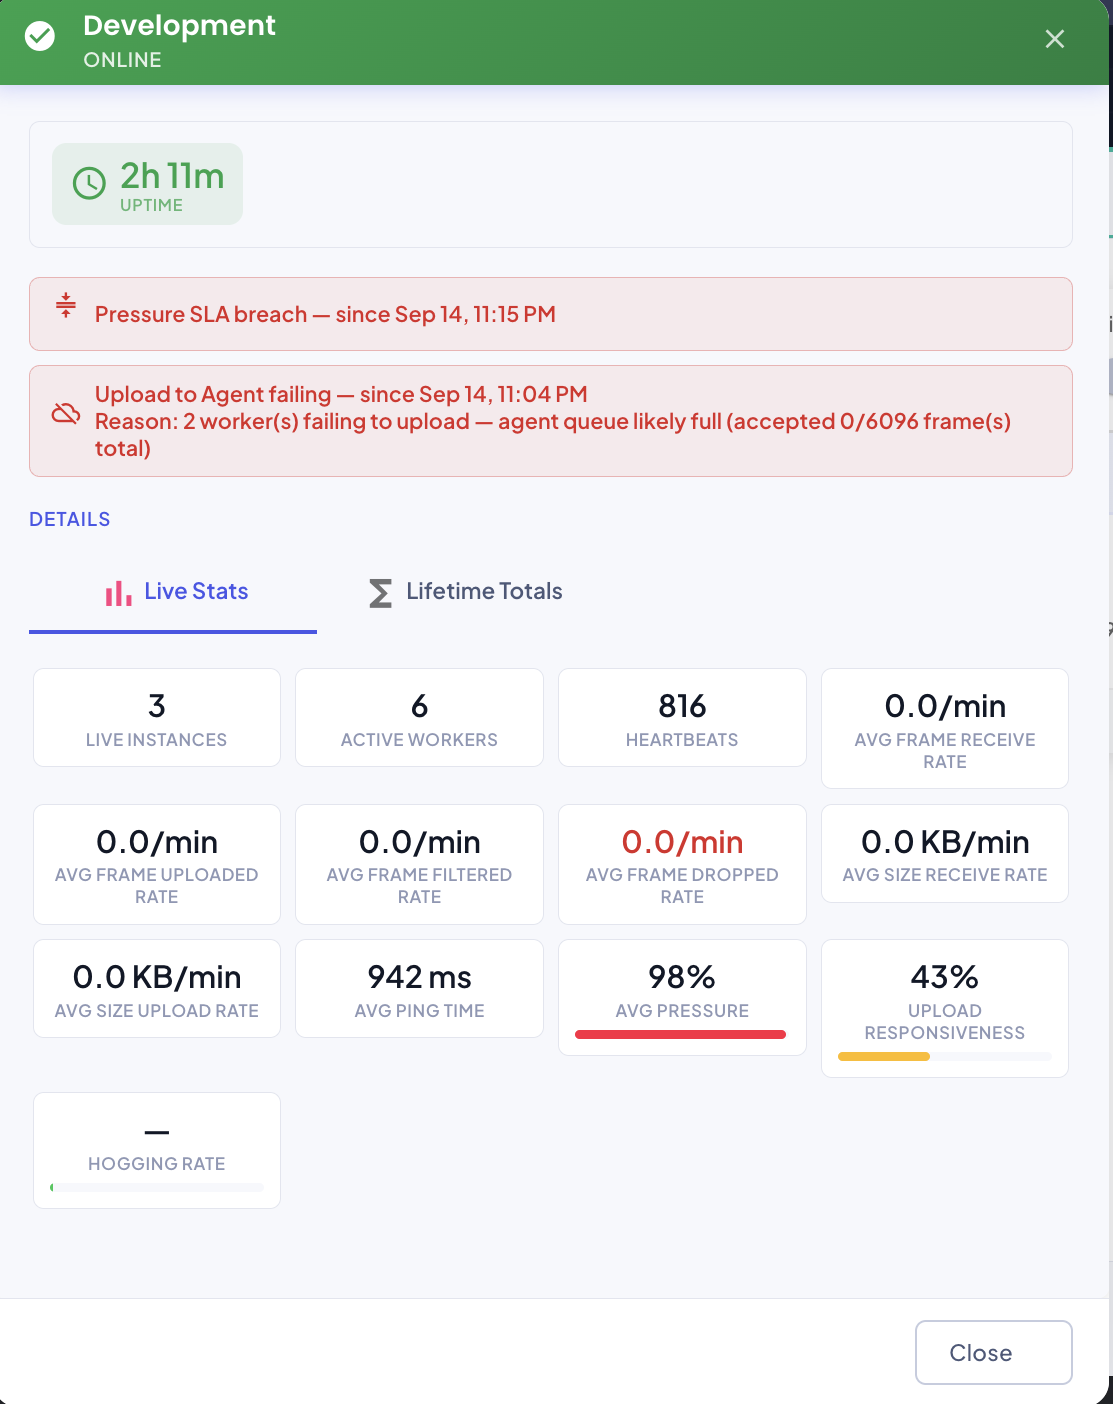
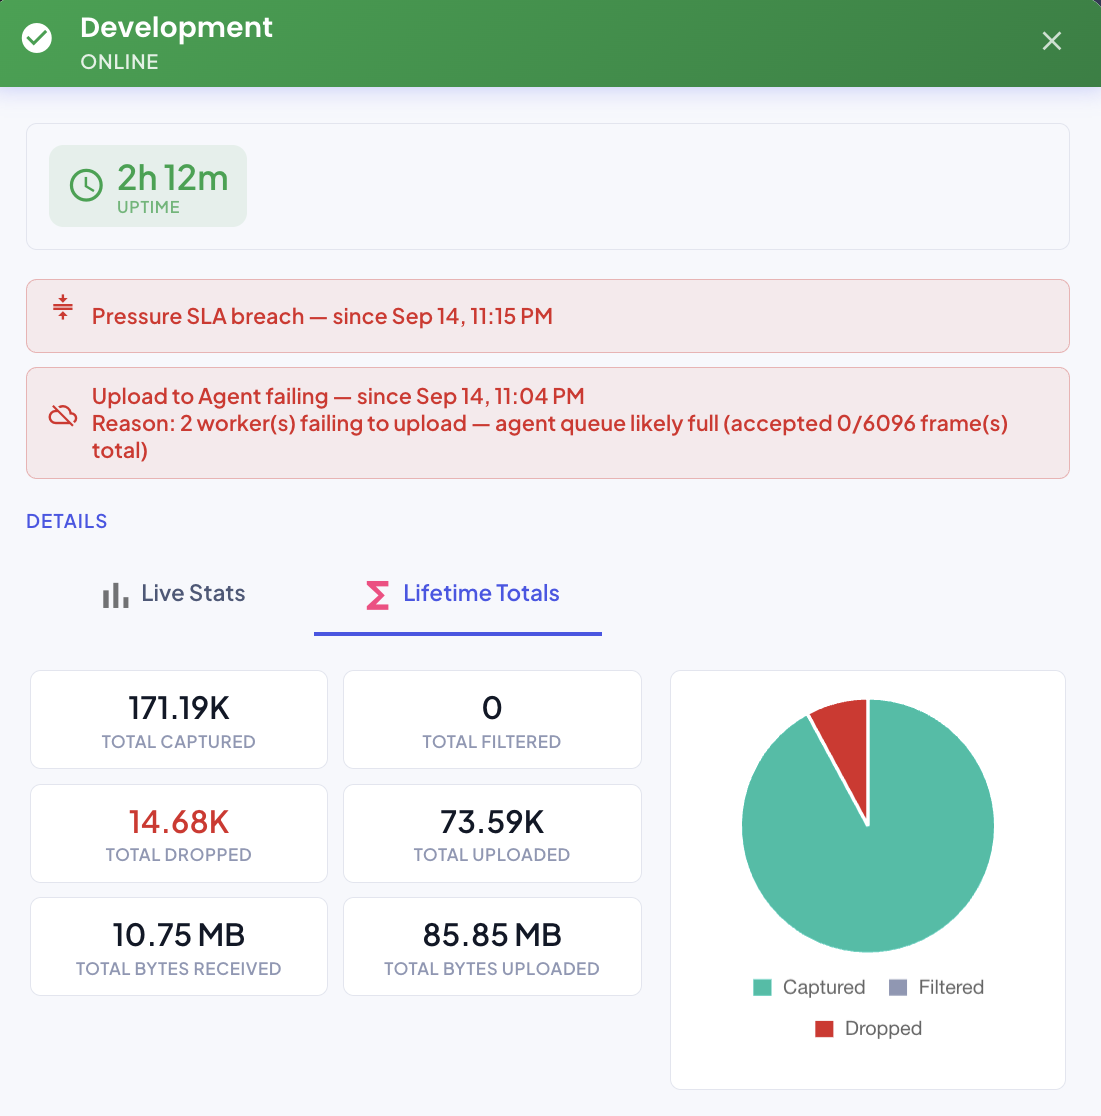
When Live Discovery Mode is on for the environment, a Discovery section with the Discovered APIs and Discovered Frames counters appears at the top of the dialog.
An Online environment can still show one or more alert banners above these tabs — see Interceptor Alerts for what each one means. Being Online just means the environment is capturing and uploading traffic right now; it says nothing about whether that traffic is healthy or whether a pending config change still needs a restart to apply.
Standby
The specific reason or reasons causing it, as a bulleted list:
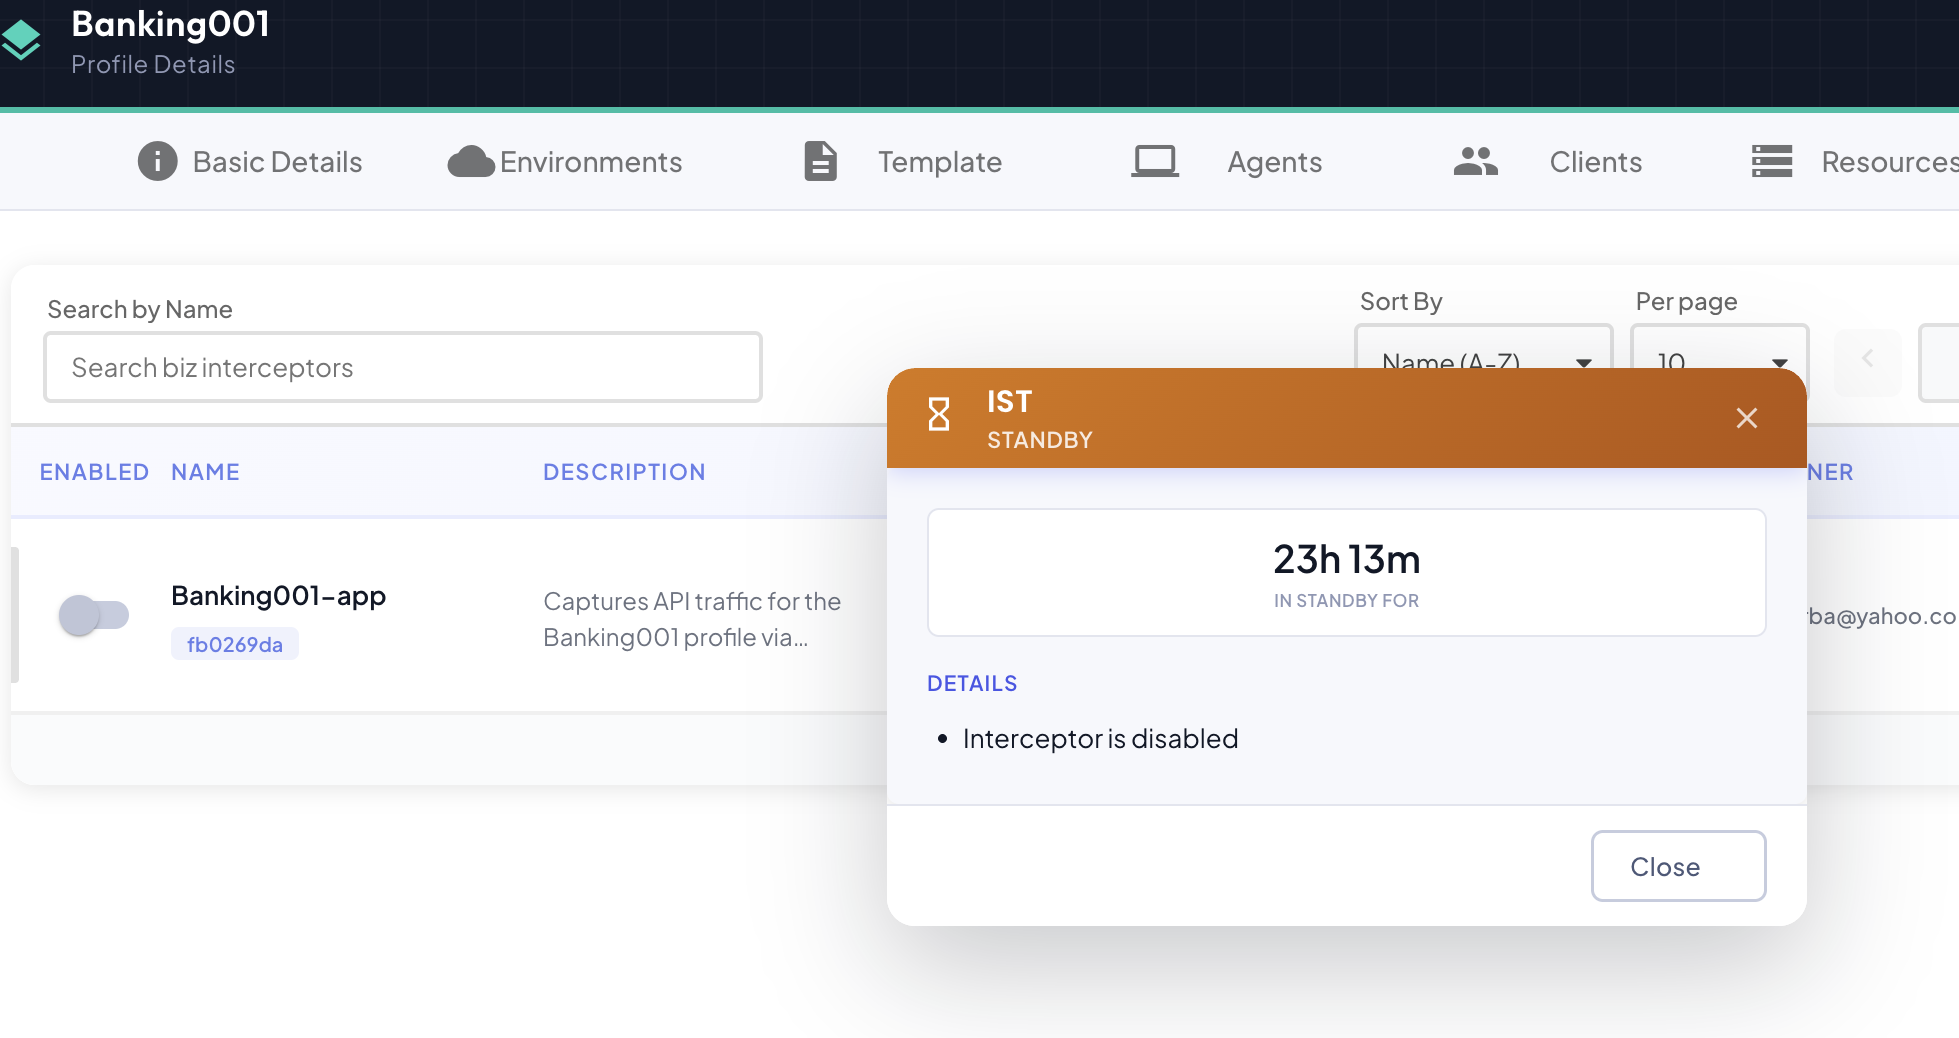
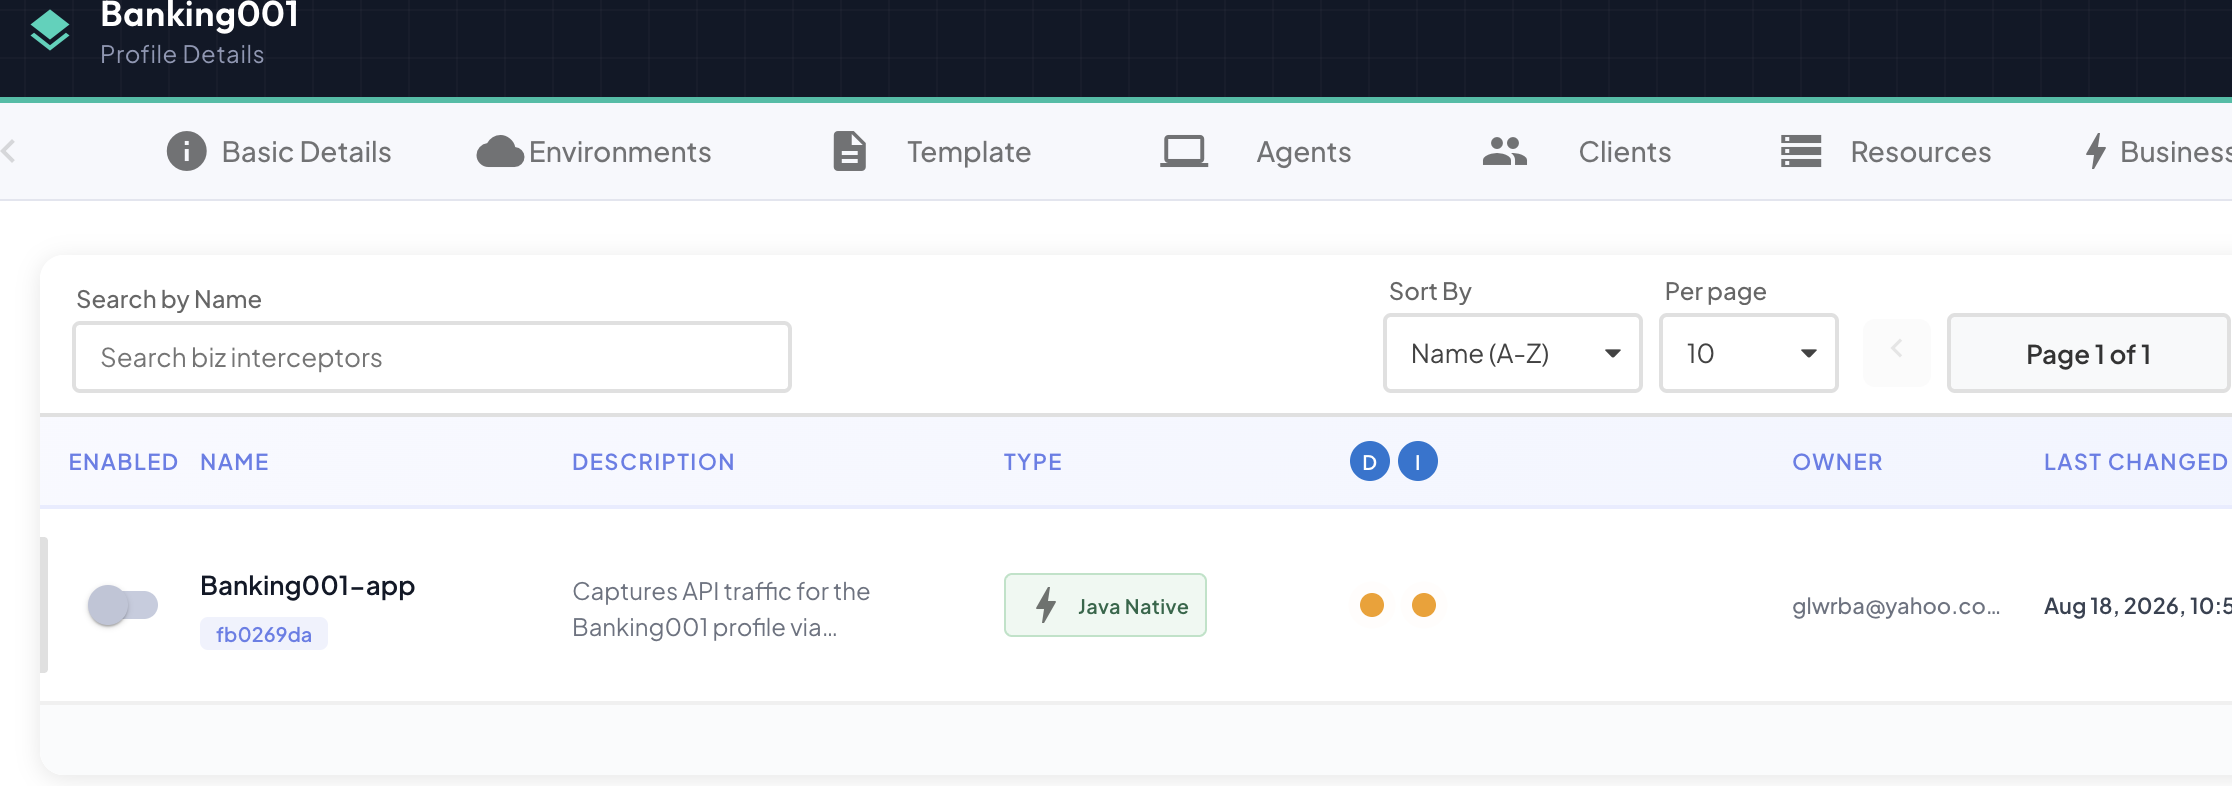
This example is what you see after turning off the interceptor's master Enabled switch on the Summary row — every environment flips to Standby, each showing "Interceptor is disabled" as its one reason, with amber dots replacing whatever color they showed before:
Unreachable
The connection error reported by the interceptor, plus its full stack trace when one was captured — or a note that no stack trace was available for that particular failure.
Offline
No additional details for an environment that was Online before and later stopped heartbeating — there's nothing to report beyond "no heartbeat."
For an environment that has never once synced, though, the dialog shows a dedicated prompt instead of a bare Offline status, since "no heartbeat" alone wouldn't tell you what to actually do about it:
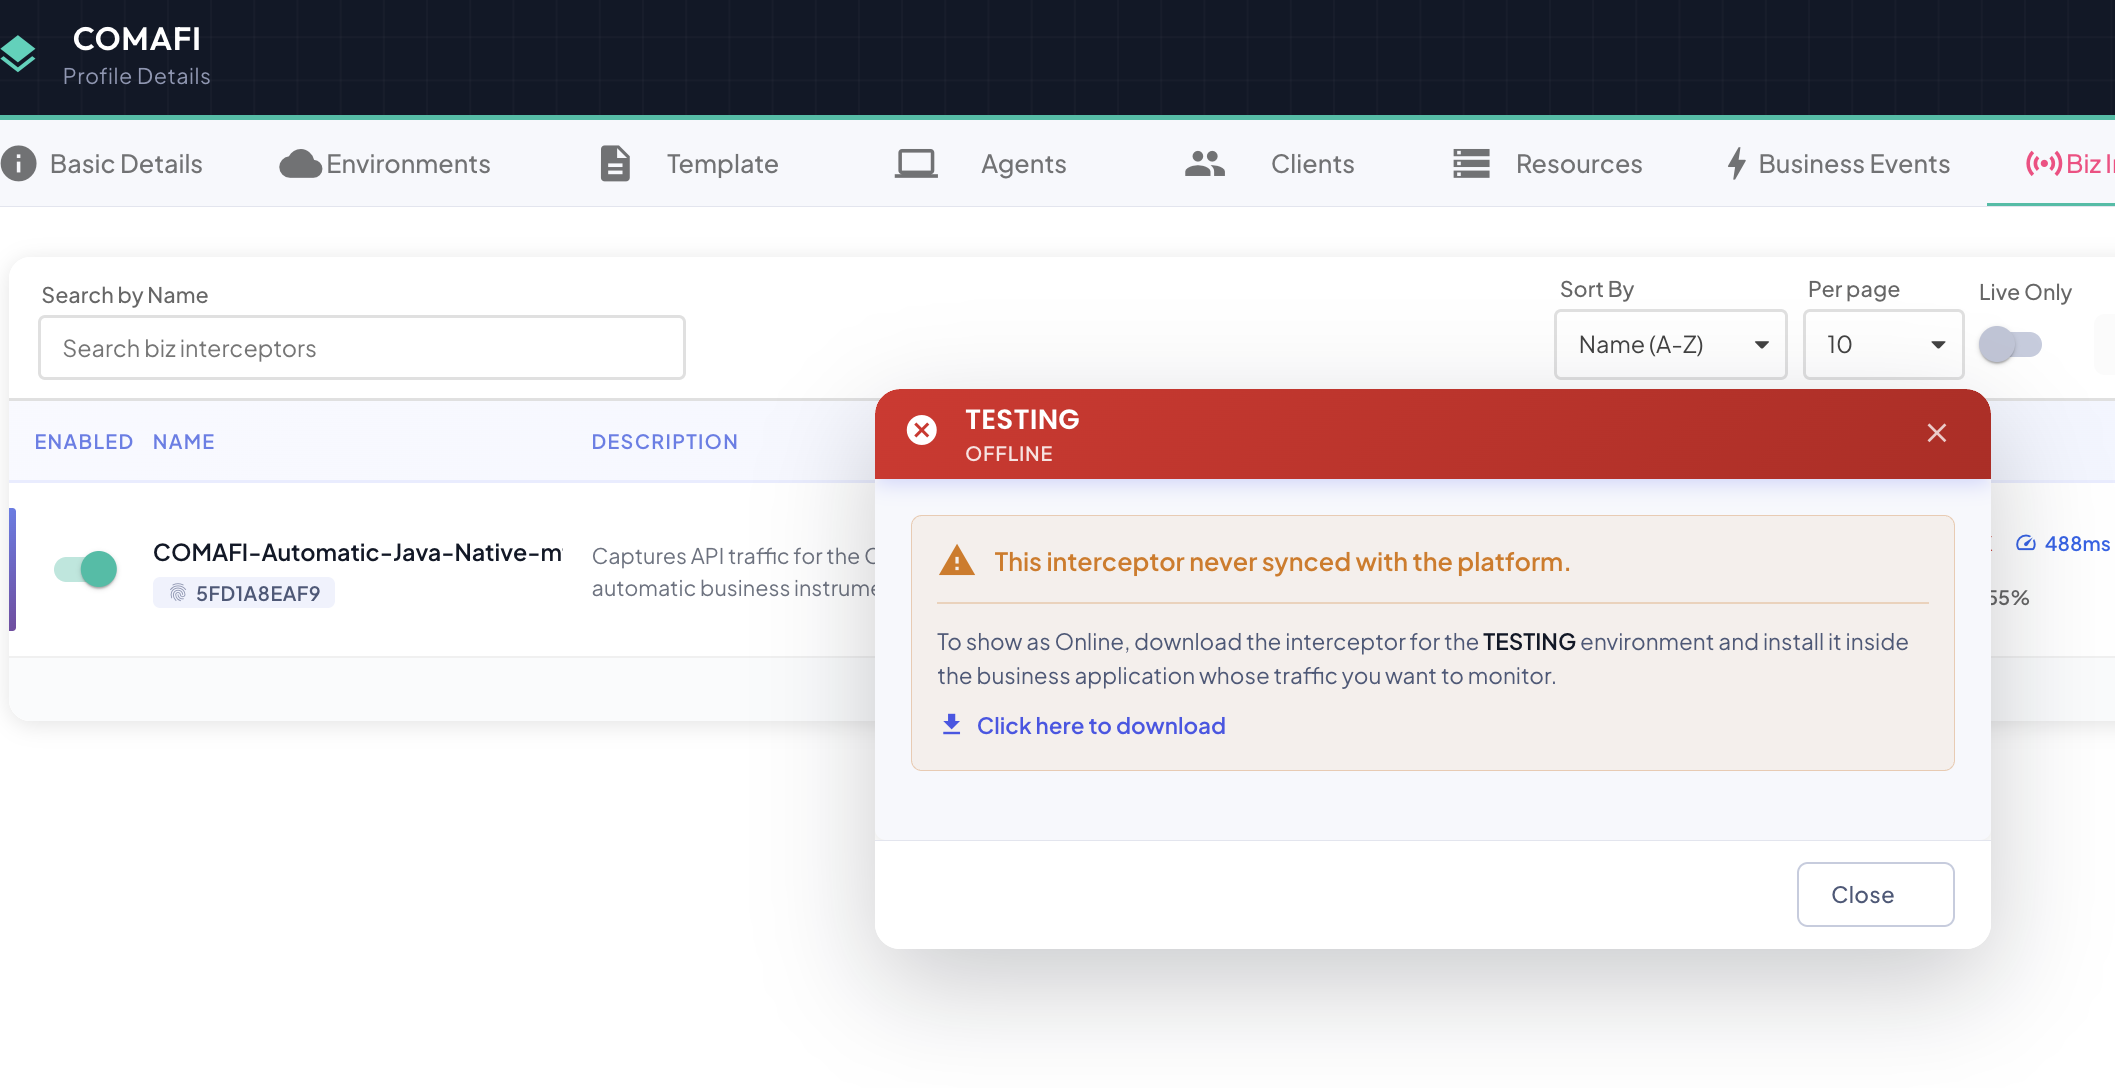
Click here to download fetches and saves the artifact for this environment directly, right from this prompt — the same .zip you'd get from the Downloading a Biz Interceptor flow's own Download button, just without needing to open that dialog and pick the environment yourself first.
Alerts
Independent of the four states above, an environment can also be flagging a Pressure Alert, Agent Latency Alert, Upload Failing, or Restart Required condition — none of these are states of their own; an environment showing one is still Online (or Standby, Unreachable, Offline) exactly as the four-state logic above already determined. See Interceptor Alerts for what each one means, where it shows up, and how it clears.