Reconfiguring (Editing) an Existing Interceptor
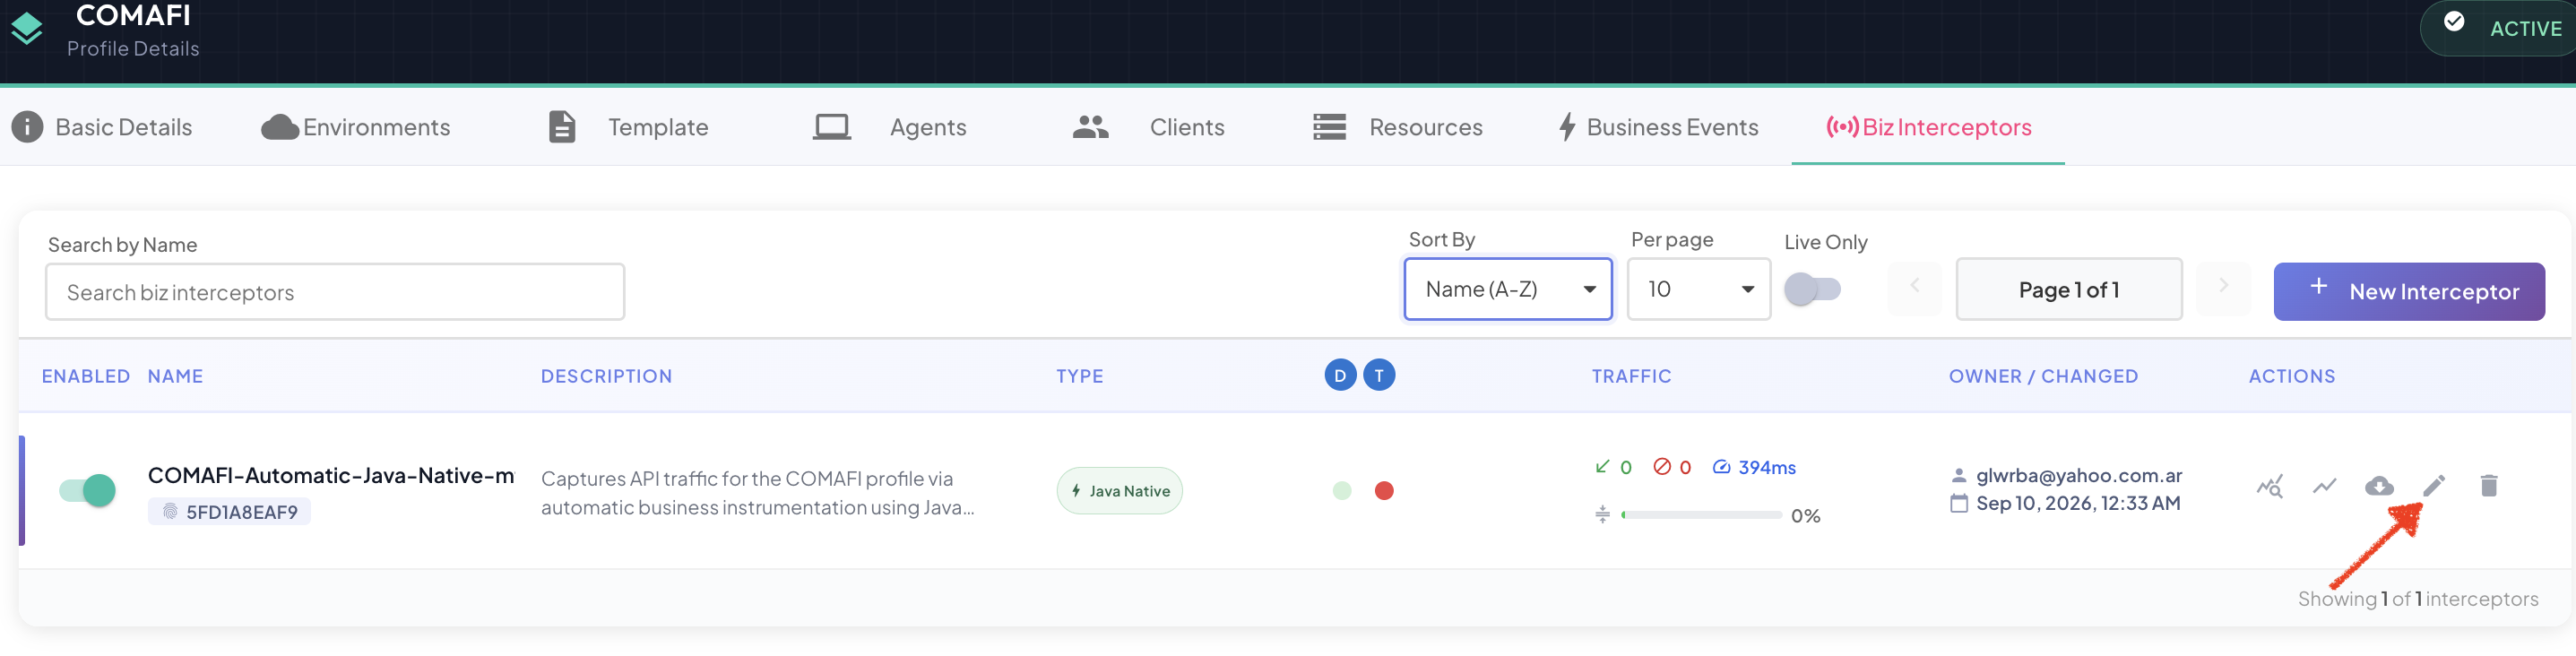
Click the Edit icon on any row of the Biz Interceptor Summary to open the Edit dialog for that interceptor.
Layout
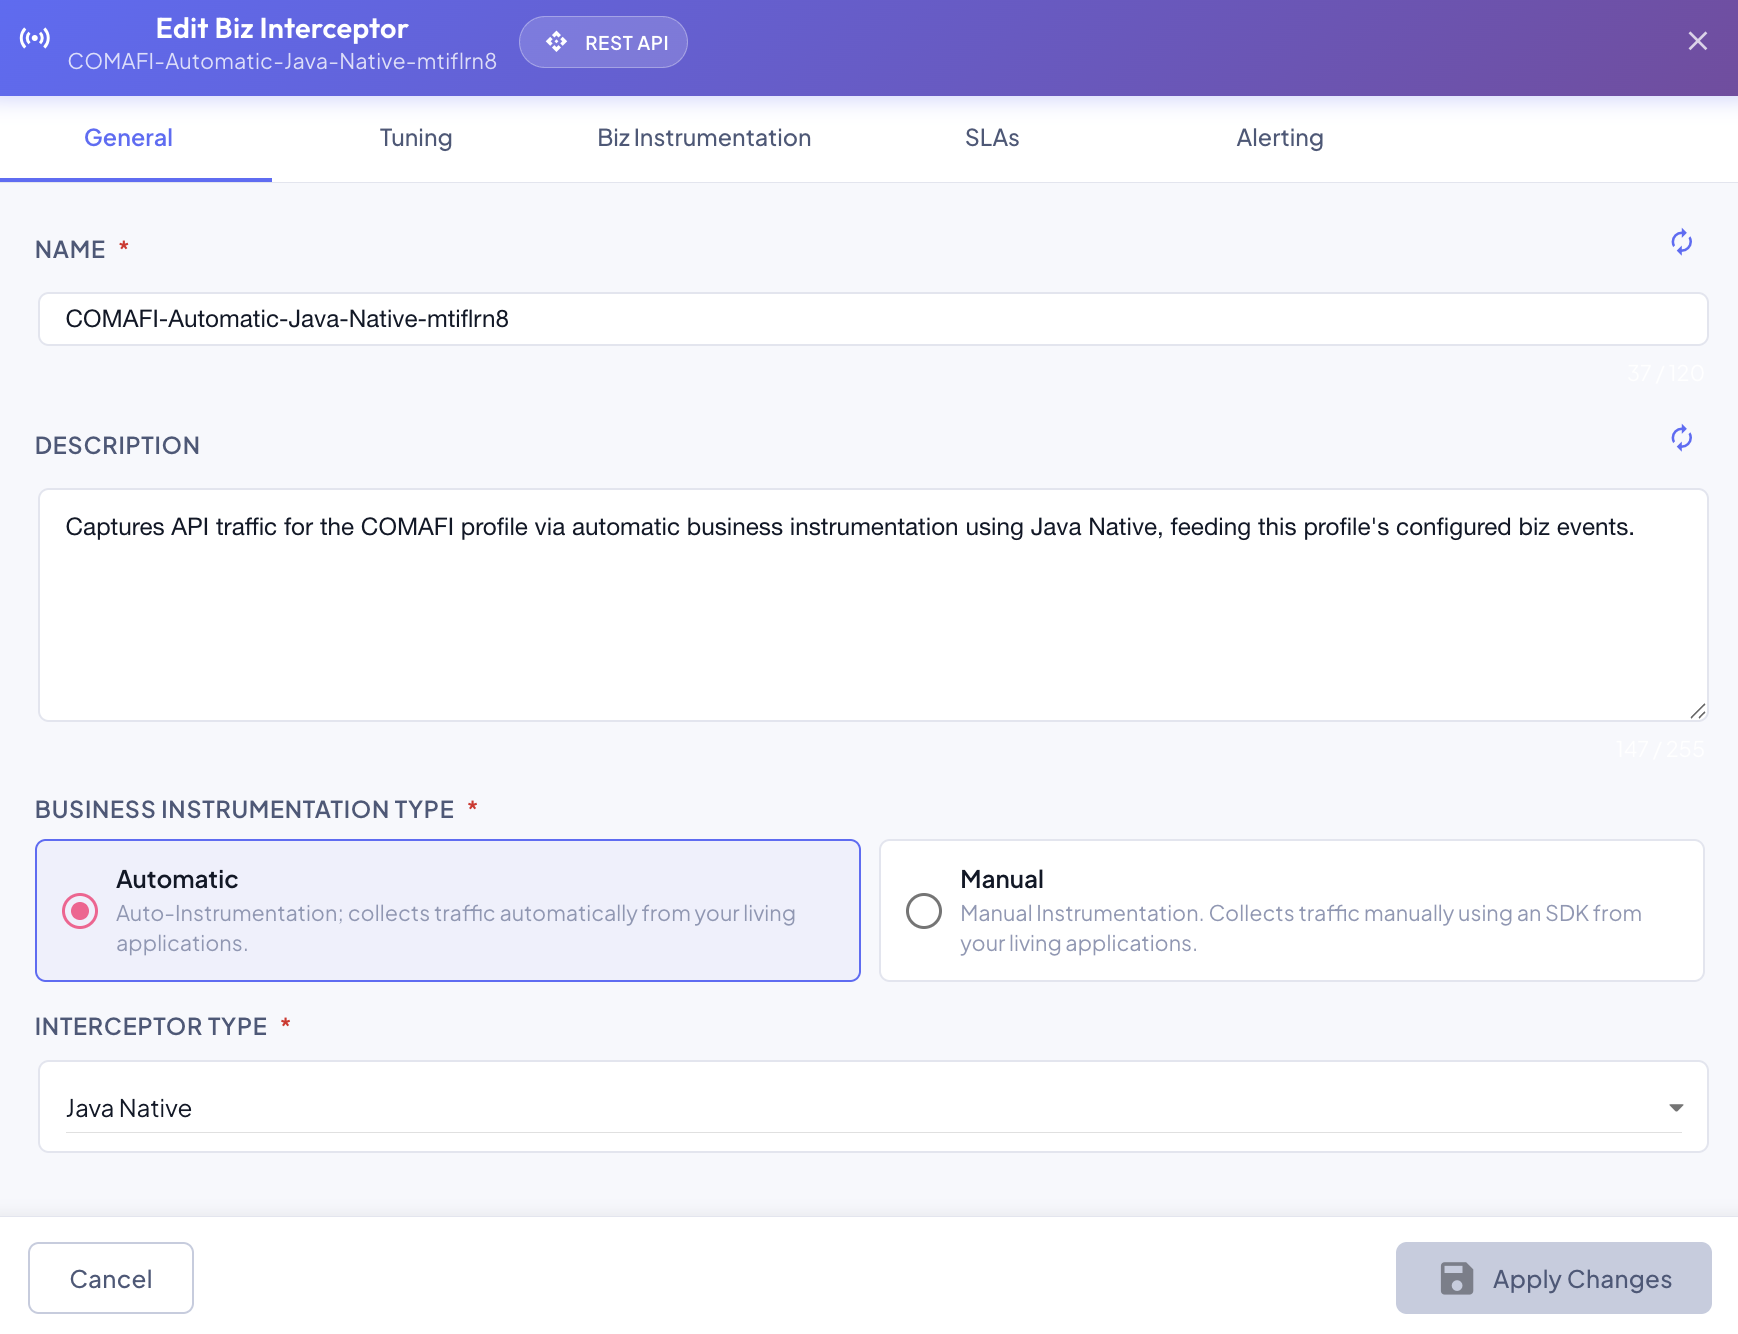
Unlike the Create wizard's linear, step-by-step flow, Edit uses freely-switchable tabs — there's no fixed order to work through, and no "Next" step to complete before another becomes available.
Transport Type is shown as a read-only badge at the top (REST API in the screenshot above) — it was fixed when the interceptor was created and can't be changed here. See Step 1 — Transport Type.
General tab
The same fields as Step 2 — General:
- Name and Description — fully editable, with the same regenerate and duplicate-name validation as at creation time.
- Business Instrumentation Type and its corresponding Interceptor Type / SDK Type — shown, but read-only. Like Transport Type, these are fixed for the interceptor's lifetime; create a new interceptor if you need a different instrumentation type or SDK.
Tuning tab
The same per-environment layout and tunable parameters as Step 3 — Tuning — enable/disable per environment, adjust its General Tuning Parameters and Self-Tuning Parameters groups, and Reset to Defaults — all fully editable here, unlike the instrumentation-type fields on the General tab.
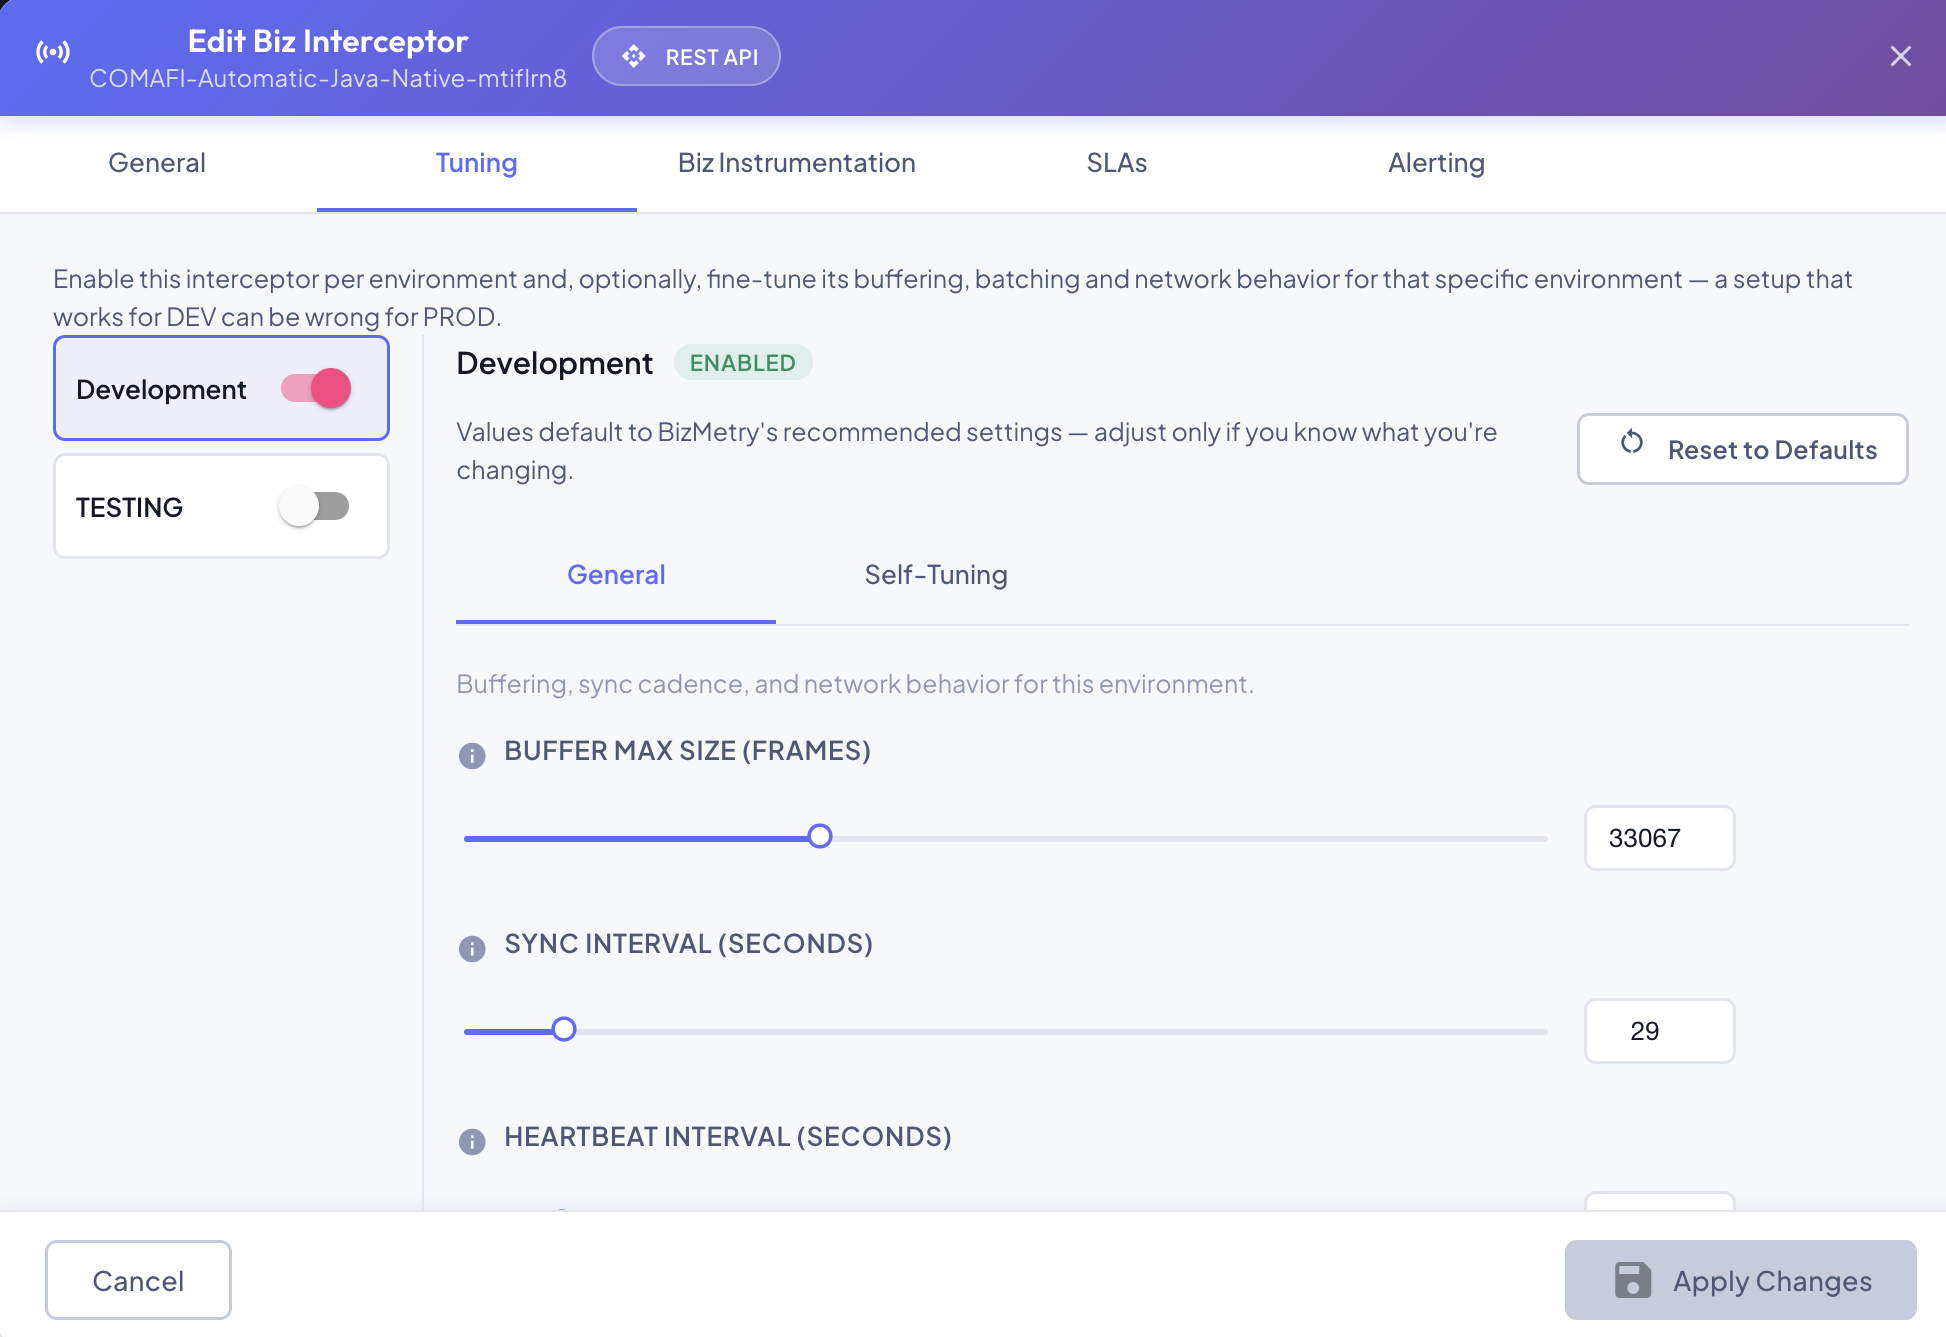
The Tuning tab also has a Discovery sub-tab, only available here and not in the create wizard, to turn on Live Discovery Mode for the selected environment. See Live Discovery Mode.
Hot-change vs. cold-start parameters
Not every parameter on this tab takes effect the same way once saved. Most do — but a couple require an actual restart of the interceptor process (and, by extension, of the business application it's embedded in) before they apply.
Hot-change — the default for most parameters (sync interval, heartbeat interval, Max Transmit Worker Count, and more). Change the value, click Apply Changes, and every running instance of that environment picks it up automatically on its next sync cycle — no restart, no interruption, nothing else to do.
Cold-start — a couple of parameters can't be applied to an already-running process at all: Buffer Max Size, and Initial Transmit Worker Count. Changing either doesn't take effect until the interceptor process itself restarts — there's no way to resize a live buffer, or change what a process starts at, out from under traffic that might currently be sitting in it. This is about the configured value only, though — see Backpressure Auto-Tuning for how the actual, in-use worker count and batch size already move on their own, continuously, with no restart involved either way.
When a cold-start change is saved, every currently-running instance of that environment is flagged as needing a restart, and this becomes visible in two places:
-
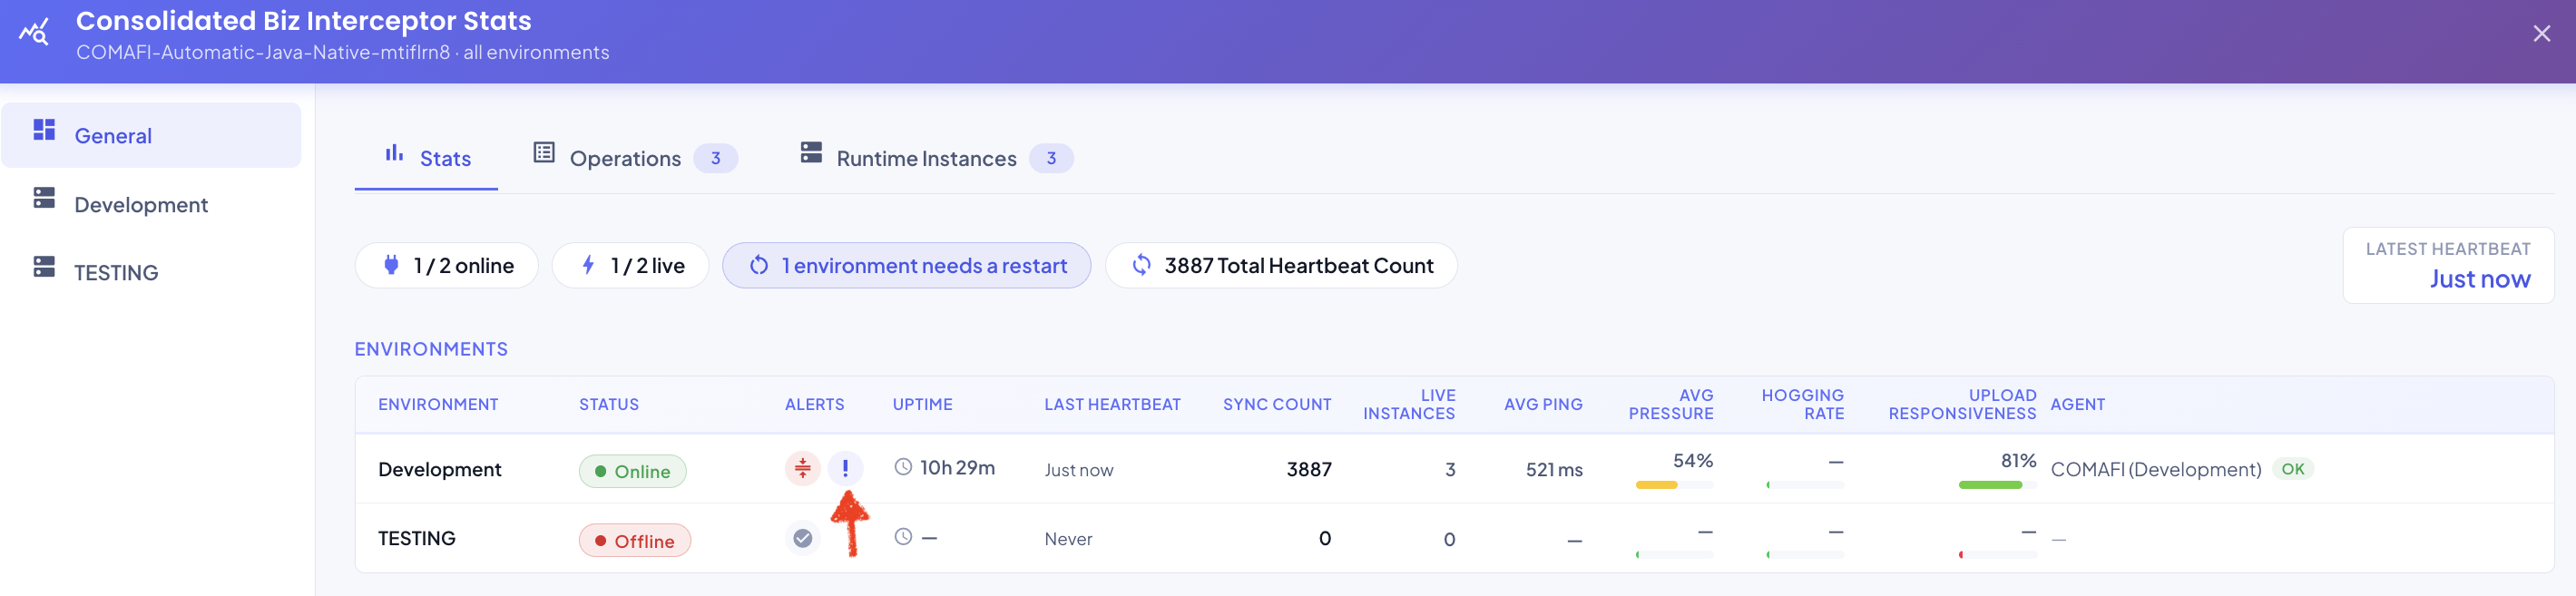
Consolidated Stats' Alerts column, for that environment, shows an exclamation-mark icon in place of the default checkmark. Hovering it explains why:
-
The Runtime Instances tab shows each affected instance with a Requires Restart status badge instead of Running:
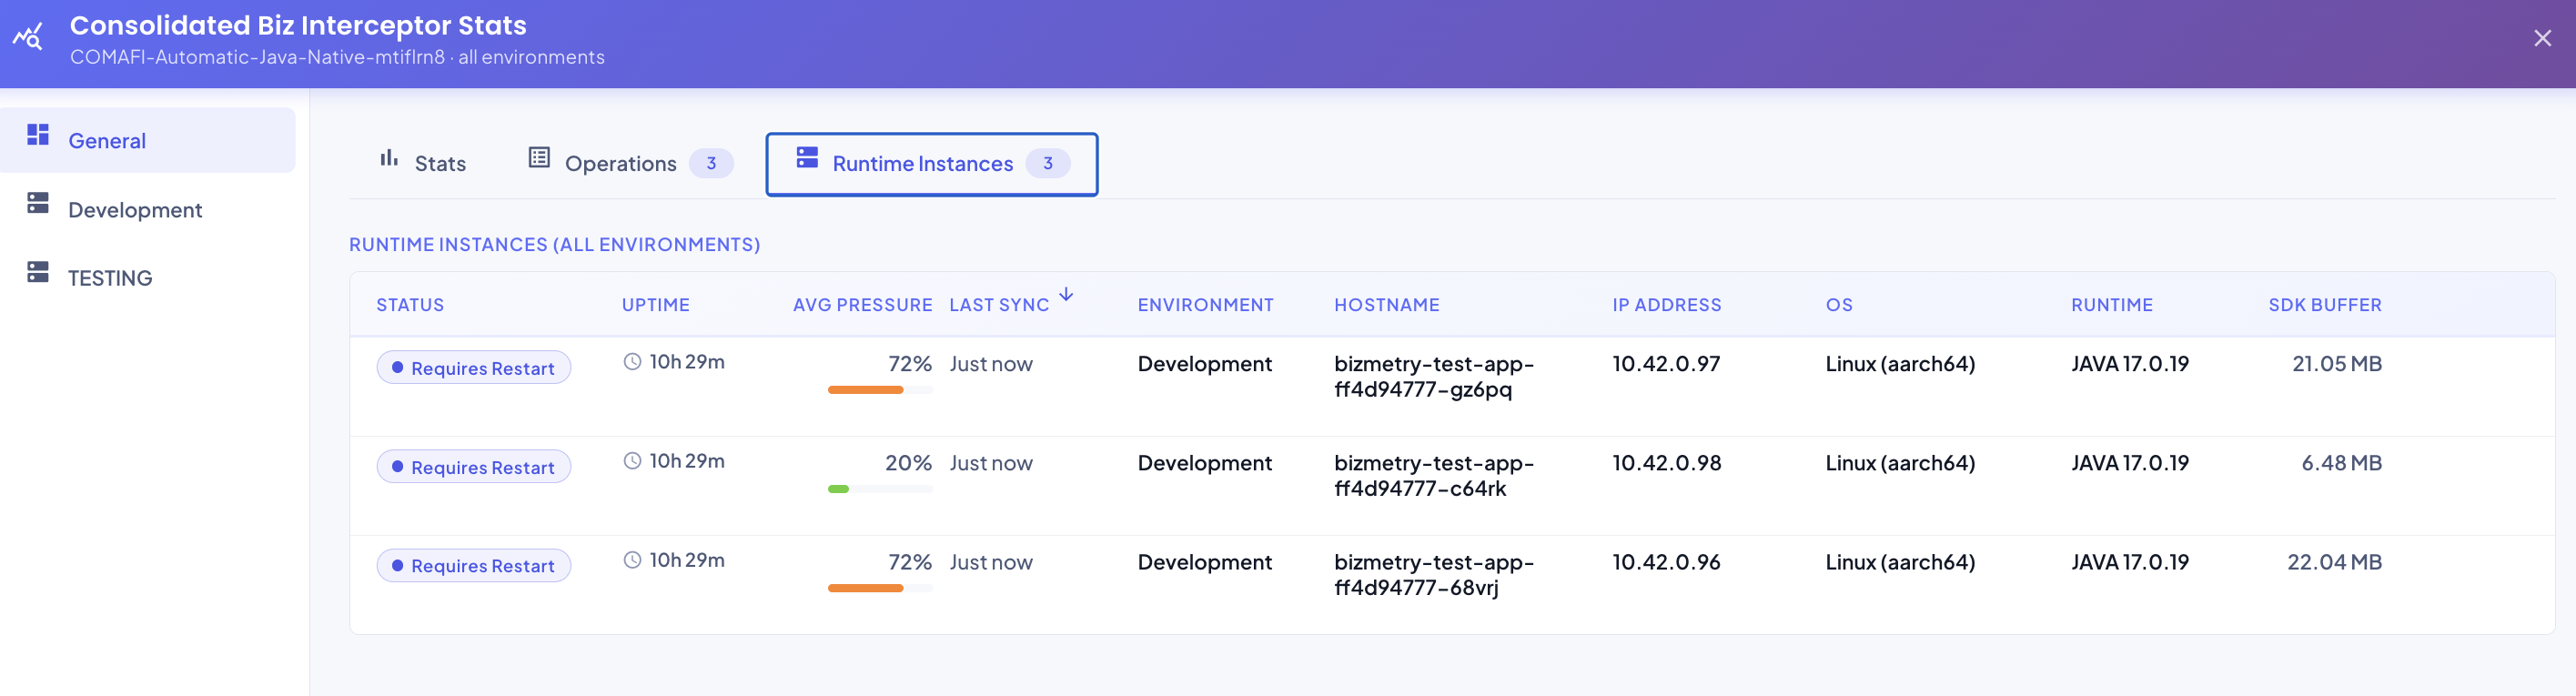
Clearing the alert needs every instance restarted
The restart-required alert doesn't clear until no instance is still reporting that status — a partial restart (some pods cycled, others not) still leaves it active. In practice this means restarting the entire business application for that environment, timed for whatever maintenance window makes sense — BizMetry doesn't restart anything on your behalf, it only flags that a restart is owed.
See also Restart Required for how the same condition shows up on the environment status dot and its detail dialog.
Self-Tuning Parameters group
Below the General group, six fields feed the backpressure auto-tuner directly rather than being applied as-is — Initial/Max Sync Batch Size, Initial/Max Transmit Worker Count, and the Worker Scale-Down/Scale-Up Pressure Threshold pair. Each "max" can never be set below its paired "initial"/"scale-down" value — the UI clamps the pair immediately, and the platform re-clamps the same way on save.
| Field | Meaning |
|---|---|
| Initial Transmit Worker Count | How many upload workers this environment's interceptor process starts with when it boots. Cold-start, same as Buffer Max Size — see above. |
| Max Transmit Worker Count | The ceiling the interceptor is allowed to scale up to on its own, at runtime. Hot-change — raise it any time, no restart needed. |
Between those two bounds — and the equivalent Initial/Max Sync Batch Size pair — each running instance's own backpressure auto-tuner continuously adjusts the active worker count and effective sync batch size based on pressure, entirely on its own — see Interceptor Fine-Tuning and Auto-Tuning for the full parameter list and Backpressure Auto-Tuning for the mechanism itself.
Biz Instrumentation tab
The same Business Event scoping as Step 4 — Biz Instrumentation — a checkbox list of every Business Event on this Profile, with Select All / Clear All to set them all at once.
A legacy (unrestricted) interceptor shows everything pre-checked
An interceptor created before this scoping existed — or one that's simply never had this tab touched — captures every Business Event on the Profile with no explicit selection stored. Opening this tab for the first time shows every row pre-checked to reflect that, but nothing is actually saved as an explicit selection unless you change something and click Apply Changes: leave it untouched and the interceptor stays unrestricted, exactly as it was before.
Once you do make a change and save, the selection becomes explicit — the interceptor is now restricted to exactly what's checked, the same as one created through Step 4 of the Create wizard.
Unlike the Create wizard's version of this step, there's no "already captured by another interceptor" attribution shown here — that's a Create-time convenience only, to help decide a sensible default when the interceptor doesn't exist yet.
If a selected Business Event is later deleted
Deleting a Business Event automatically removes it from the scope of every interceptor that had it selected — including this one — and clears out any of that Business Event's operations from this interceptor's already-captured historical stats (the Operations table in Consolidated Stats), so a deleted Business Event never lingers there as a stale, un-removable row. No manual cleanup needed on this tab.
SLAs tab
Configures the thresholds that drive the Pressure Alert and Agent Latency Alert badges shown throughout Consolidated Stats and Environment Status. A sub-tab picker at the top switches between the two independent metrics — Pressure and Agent Latency — each with its own identical set of controls below it.
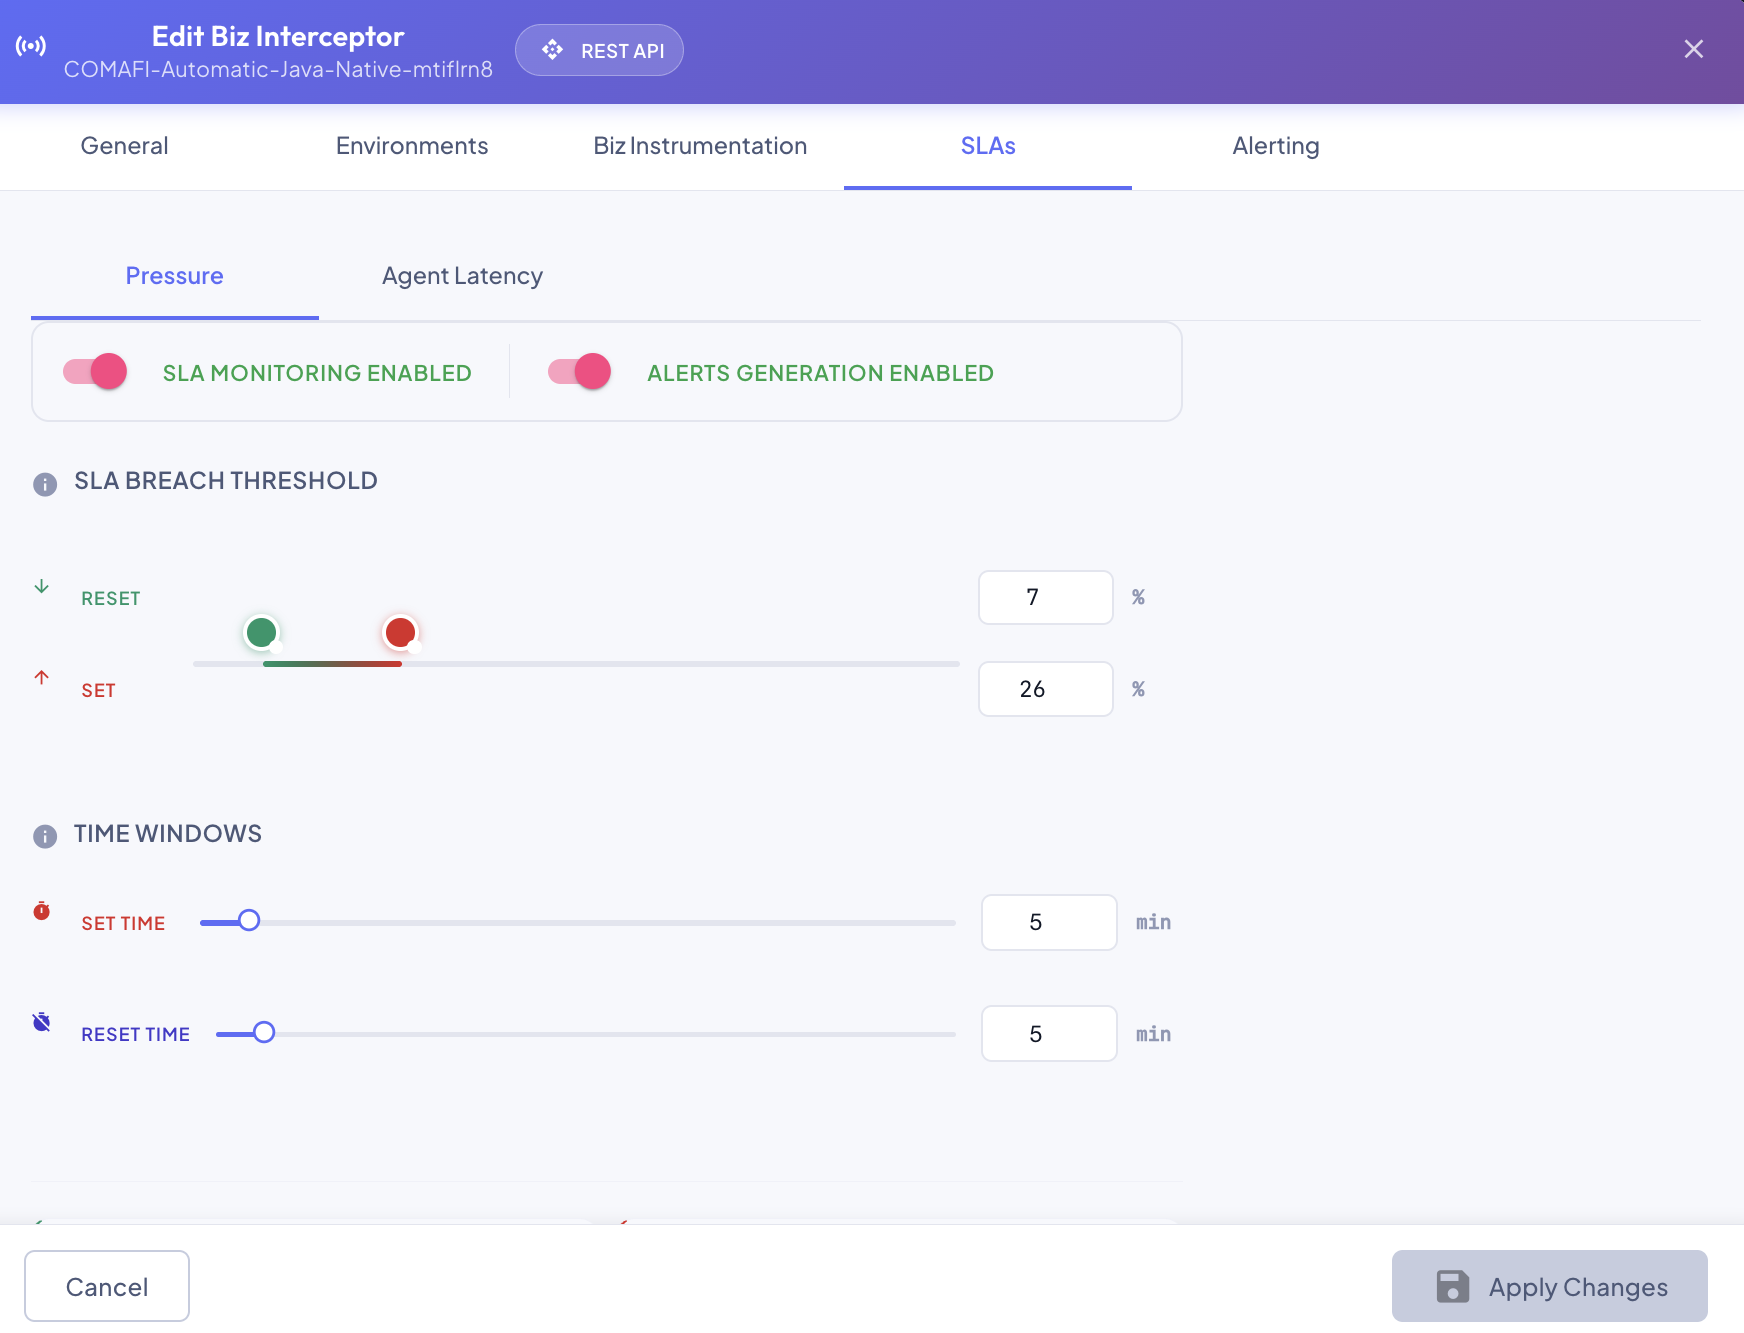
| Control | Description |
|---|---|
| SLA Monitoring Enabled | Whether this metric is evaluated against its thresholds at all. Off means the metric is still tracked and shown (e.g. Avg Pressure still appears in Consolidated Stats), it just never triggers an alert. |
| Alerts Generation Enabled | Whether crossing the Set threshold actually raises an alert (and, if configured, sends a notification per the Alerting tab below). Only meaningful when SLA Monitoring is also on. |
| SLA Breach Threshold — Set | The percentage the metric must reach (and stay at or above) to trigger the alert. |
| SLA Breach Threshold — Reset | The percentage the metric must drop back to (and stay at or below) to clear an already-triggered alert. Kept lower than Set on purpose — this hysteresis gap stops a value hovering right at the edge from rapidly flipping the alert on and off. |
| Set Time | How many consecutive minutes the metric has to stay at or above Set before the alert actually fires — a brief spike alone isn't enough. |
| Reset Time | How many consecutive minutes it has to stay at or below Reset before the alert actually clears. |
Both the threshold values and the two sliders are draggable, or type an exact number directly into the field next to each — same dual-input pattern as Step 3 — Tuning's tuning parameters.
Pressure vs. Agent Latency — same controls, different metric
Pressure is the interceptor's own buffer occupancy — how full its in-memory store-and-forward buffer is, as a percentage of Buffer Max Size (see Step 3 — Tuning). Sustained high pressure means the interceptor is capturing traffic faster than it can sync it out, and frames start getting dropped once the buffer is completely full. Agent Latency instead tracks round-trip time to the environment's Agent. Both are evaluated, and can alert, completely independently of one another — an interceptor can be under pressure without any latency issue, or vice versa.
Alerting tab
Configures where a triggered SLA alert actually gets sent — separate from the SLAs tab's whether/when it triggers in the first place.
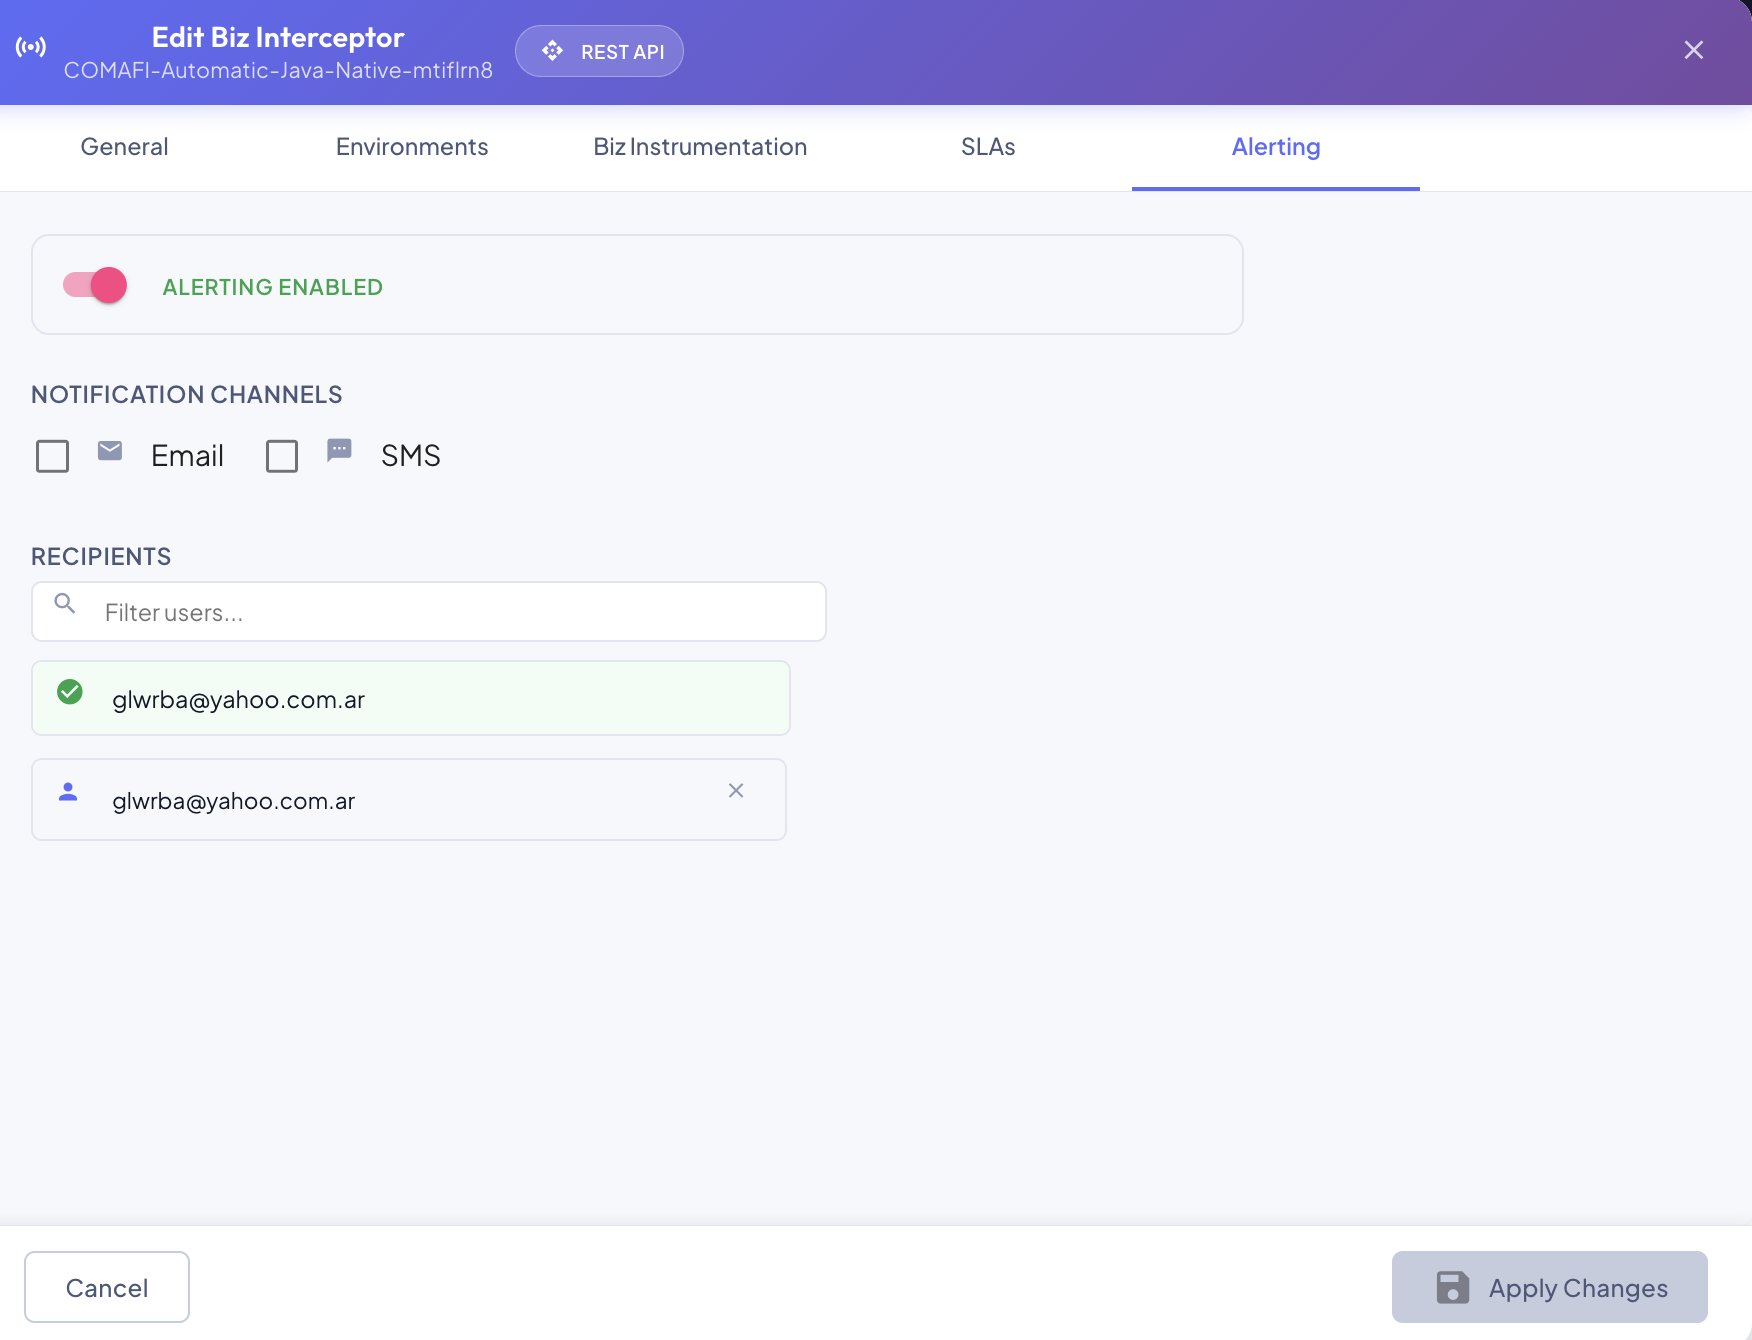
- Alerting Enabled — the master switch for this tab. Off means SLA alerts still show up in the UI (badges, tooltips, banners) exactly as usual, but no notification is ever sent.
- Notification Channels — Email and/or SMS, independently toggleable.
- Recipients — search and select which users receive the notification. Use the Filter users… box to narrow a long user list before picking.
Saving Changes
Click Apply Changes to save. The button stays disabled until there's at least one actual change to apply, and re-disables immediately after a successful save.
Most changes to per-environment parameters take effect the next time that environment's interceptor process syncs — see Understanding Interceptor Synchronization with the BizMetry Platform for exactly how that cycle works. A handful of parameters (Buffer Max Size chief among them) are the exception — see Hot-change vs. cold-start parameters above for which ones need an actual restart instead.