Stats Tab
The Stats tab is the default view of Consolidated Stats — general runtime statistics for the interceptor: connection status, heartbeat/sync counts, capture totals, pressure, and, on the General scope specifically, a per-environment breakdown via the Environments Table below. See Layout for how scope and tabs combine if you landed on this page directly.
Summary Badges
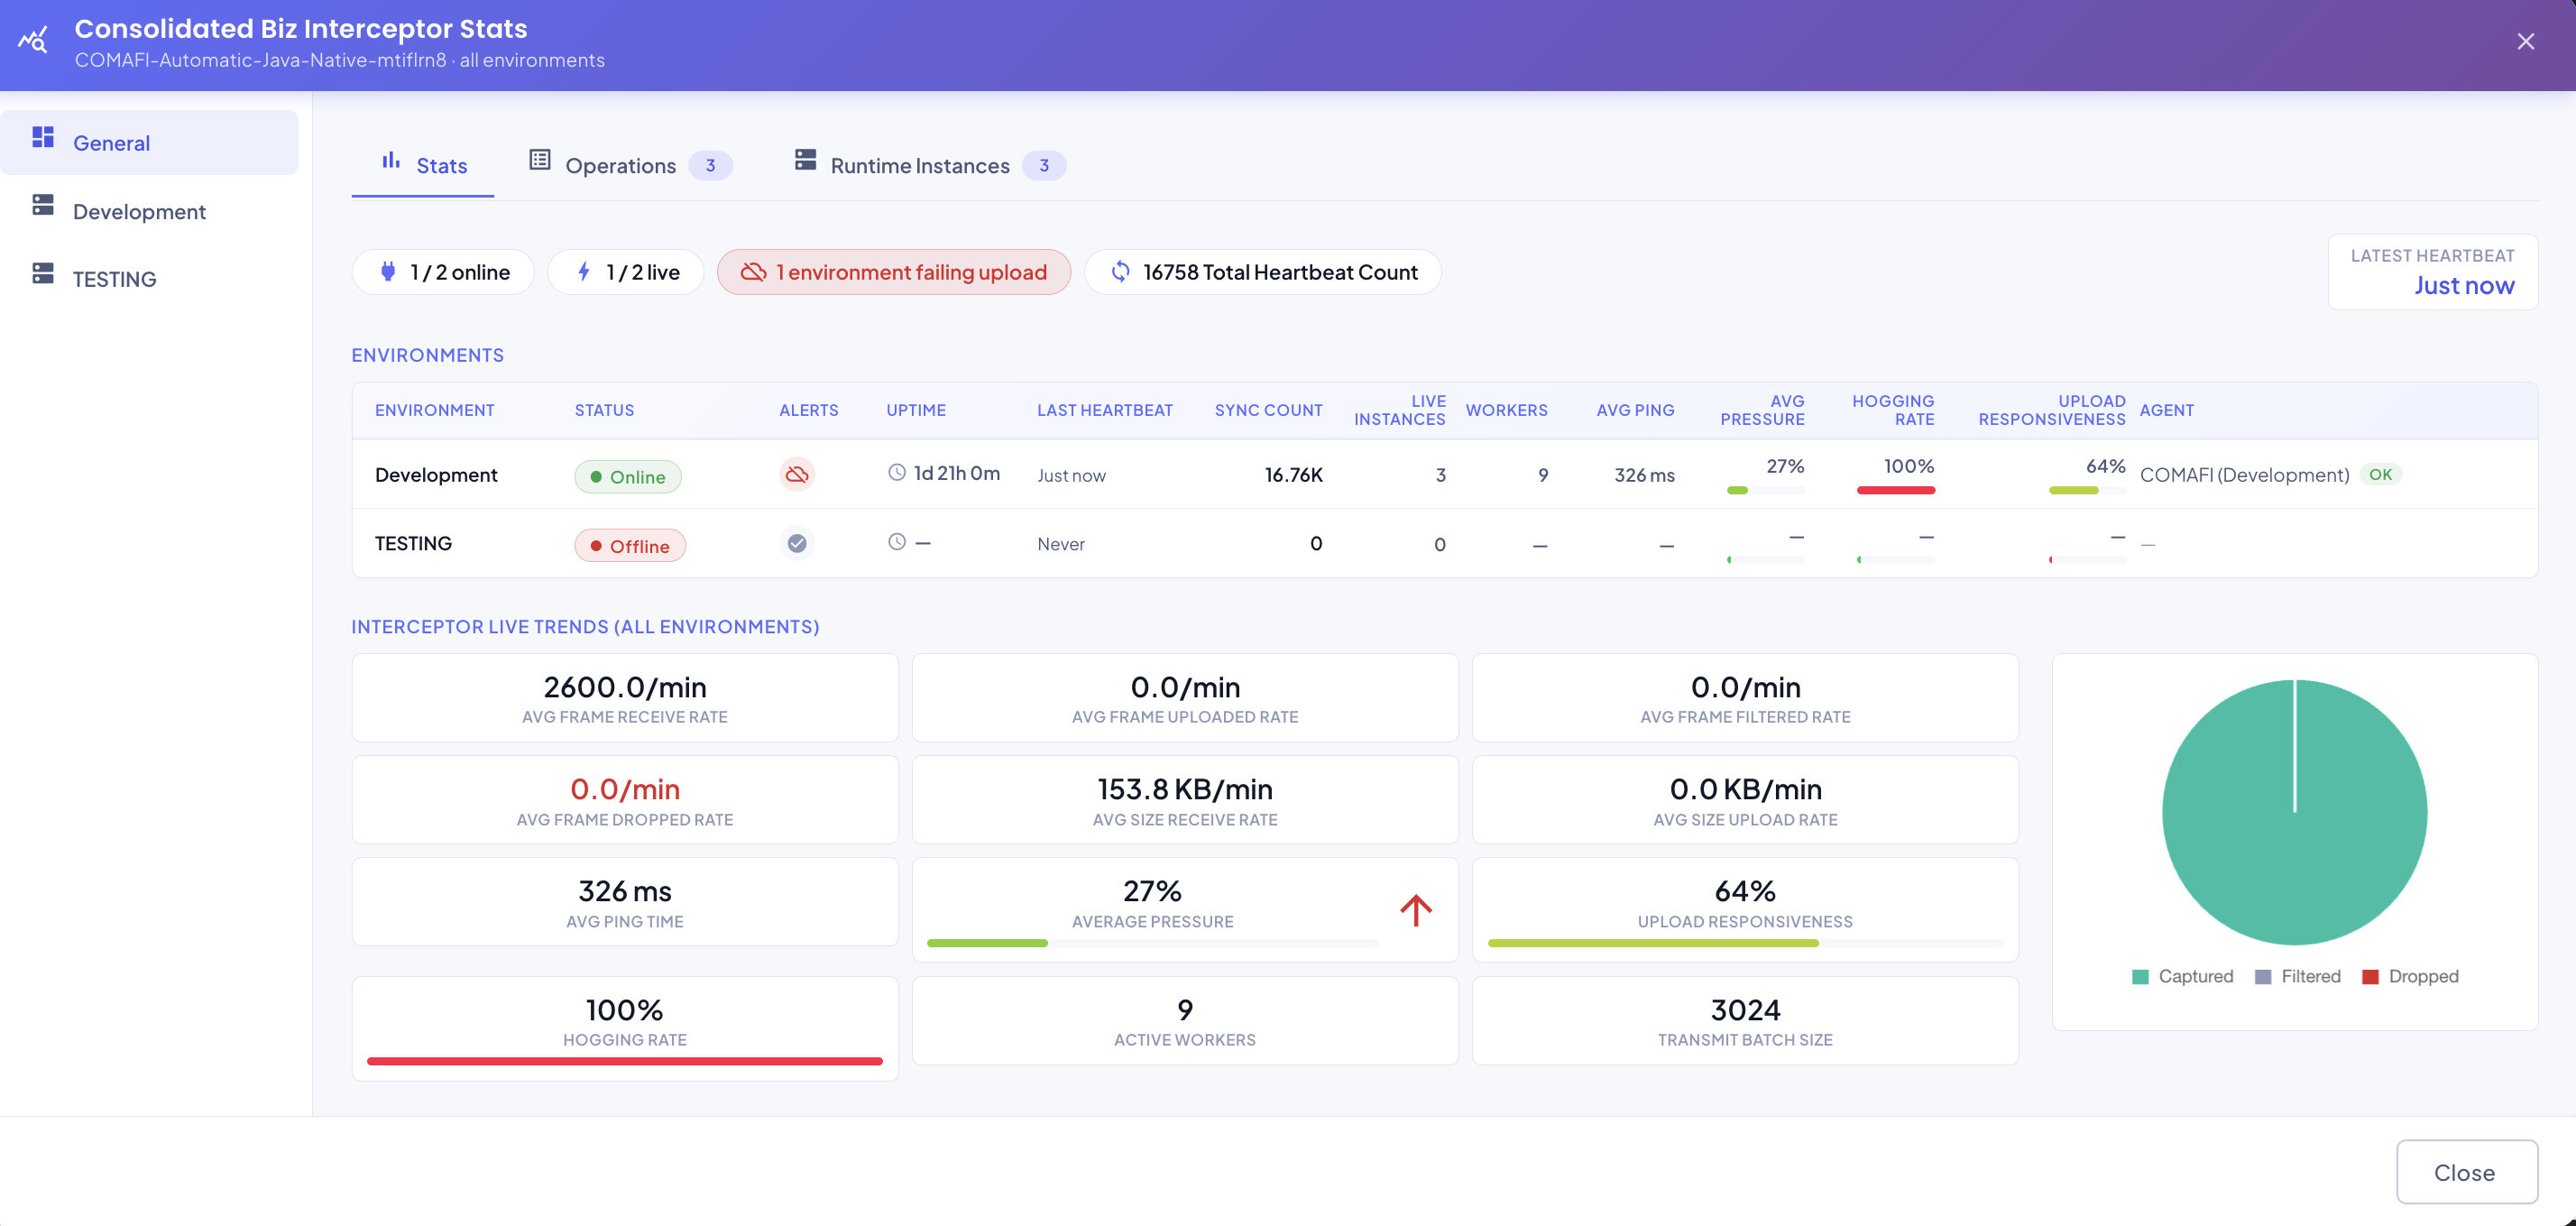
Along the top of this tab, on the General scope:
- Online / Live counts — how many of this interceptor's environments are currently Online, and how many are actually Live (Online and sourcing at least one live Business Event).
- N environment(s) needs a restart — only shown when at least one environment has a pending config change waiting on a restart; see Restart Required.
- Total Heartbeat Count — sum of successful syncs across every environment.
- Latest Heartbeat — how long ago the most recent heartbeat was received, from any environment.
Switching scope (left-hand nav) to an individual environment replaces these badges with that environment's own status cards instead:
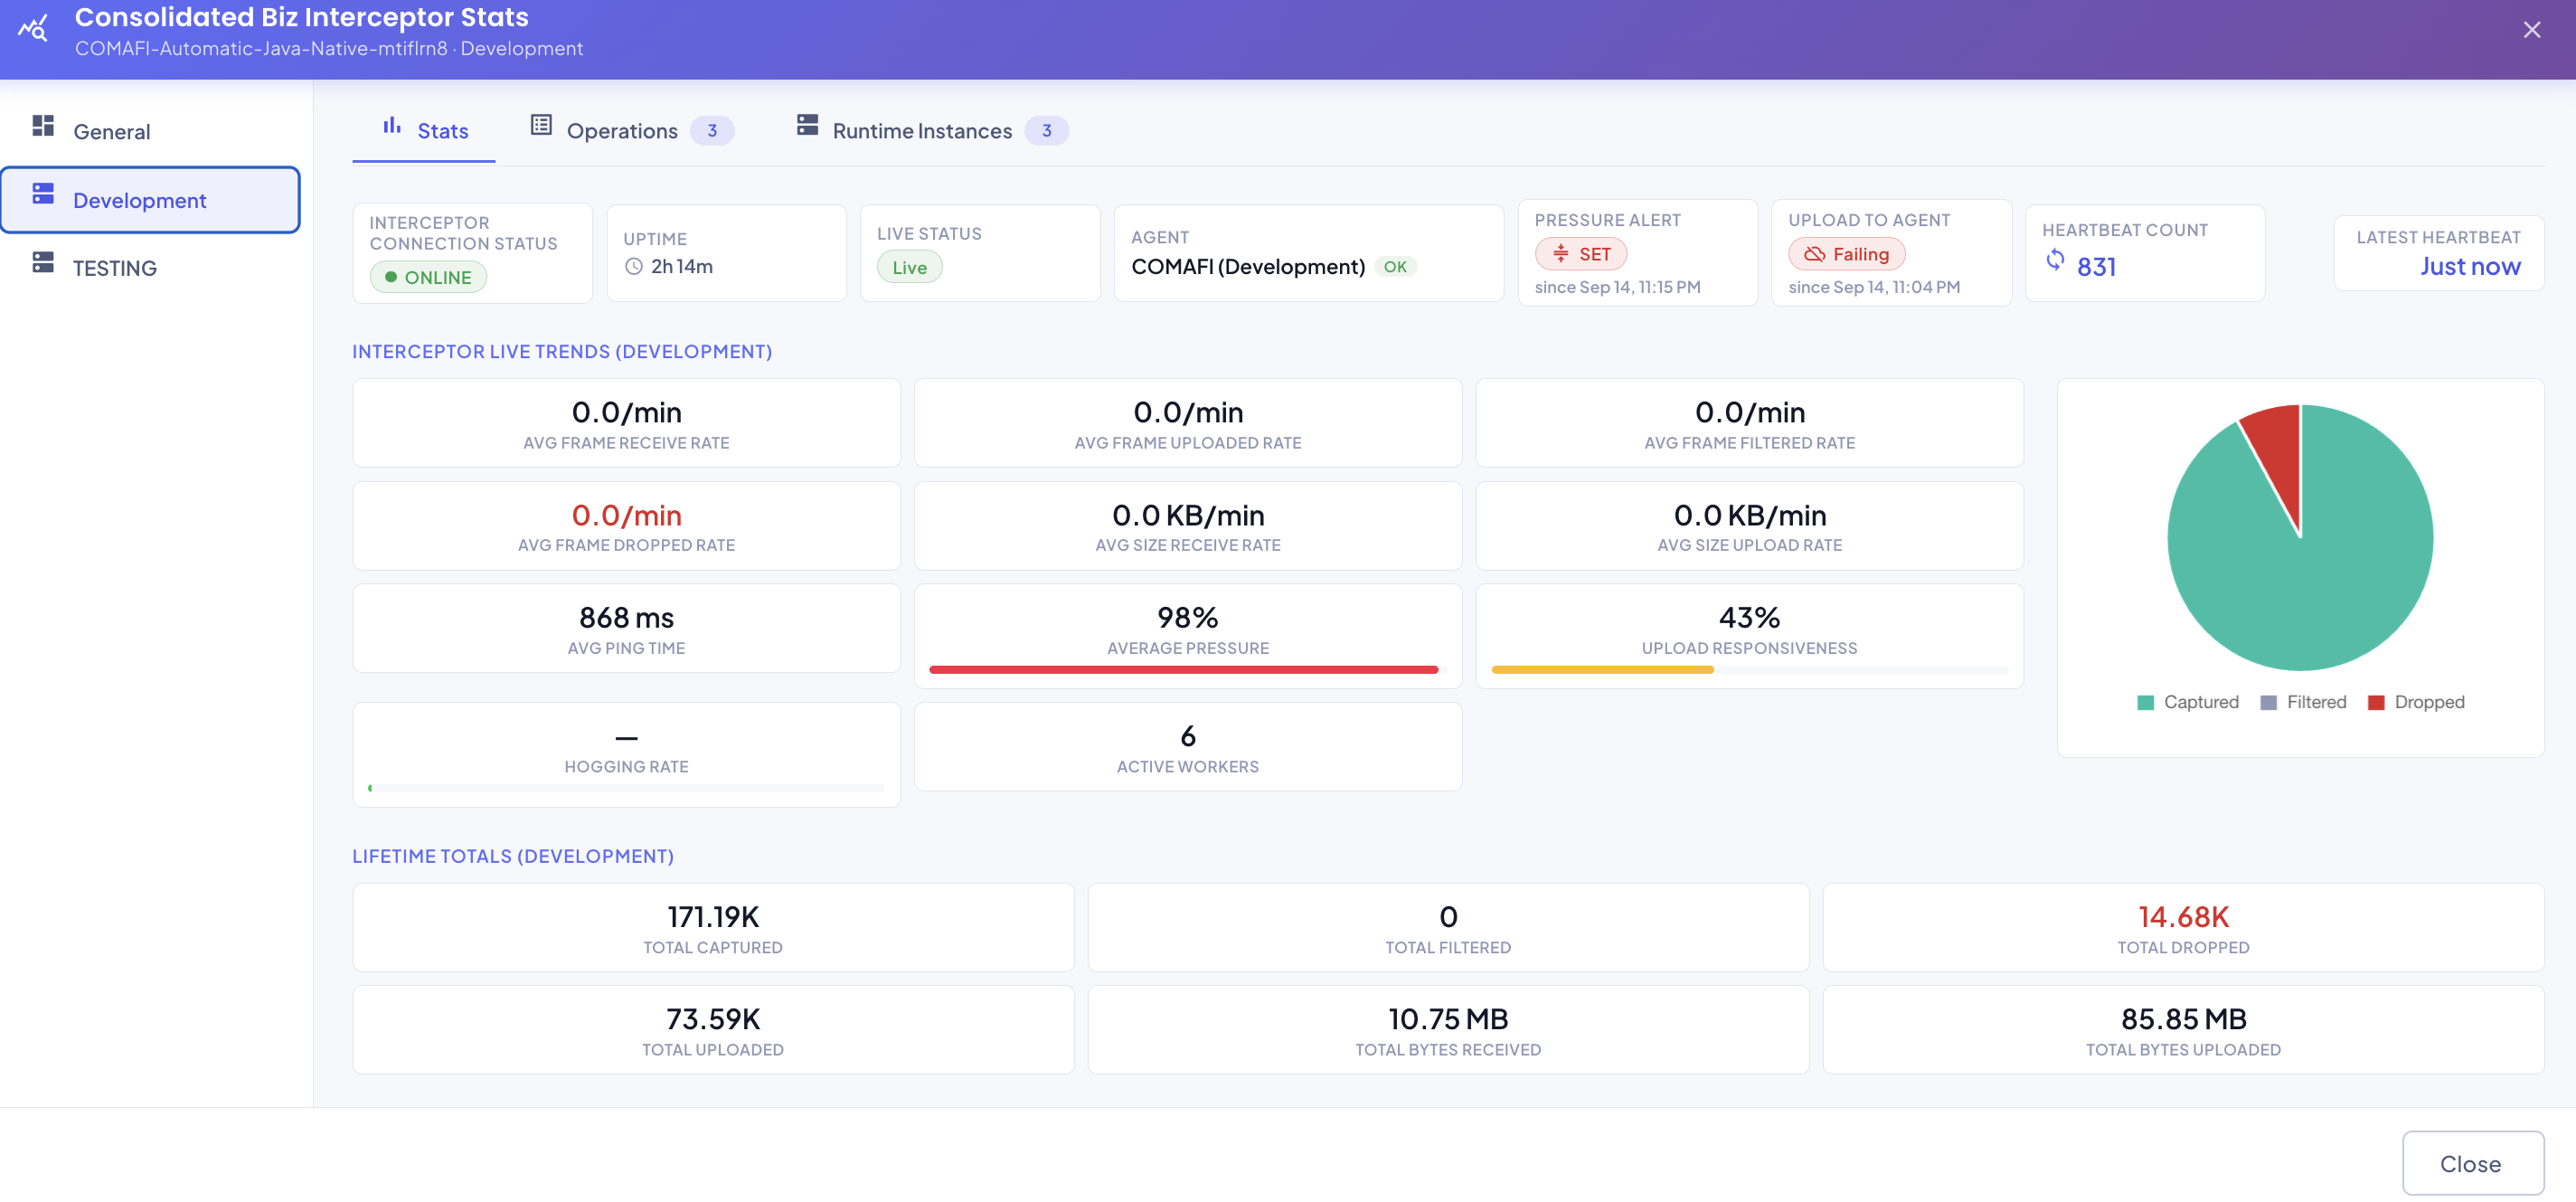
| Card | Meaning |
|---|---|
| Interceptor Connection Status | This environment's current 4-state runtime status. |
| Uptime | How long this environment's interceptor process has been running continuously — resets only on an actual restart, not on a transient status flap. |
| Live Status | Whether this environment is currently Live. |
| Agent | The Agent this environment uploads to, and whether it's currently reachable. |
| Heartbeat Count | Total successful syncs for this environment specifically. |
Environments Table
General scope only
This table is specific to the General scope — it's the one place the interceptor's environments are all compared side by side. Switching to an individual environment's scope replaces it with that one environment's own status cards (above) instead, since there's nothing left to break down by environment once you've already picked one.
On the Stats tab, the General scope's Environments table lists every environment this interceptor is configured for, one row each:
| Column | Description |
|---|---|
| Environment | Environment name. |
| Status | The 4-state runtime status badge. |
| Alerts | A gray checkmark when everything's within threshold, replaced by one colored icon per active Pressure Alert or Agent Latency Alert — hover for when the breach started. Can show more than one icon at once if both metrics are alerting simultaneously, or alongside a restart-required indicator. |
| Uptime | Continuous runtime since the interceptor process last started, for this environment. Shows — for any status other than Online. |
| Last Heartbeat | How long ago this environment last synced. |
| Sync Count | Total successful syncs for this environment. |
| Live Instances | How many of this environment's running instances are currently sourcing at least one live operation. |
| Workers | Total transmit workers currently active across this environment's instances, right now — a sum, not an average. Each instance's own backpressure auto-tuner moves its own active count up and down independently as load changes, so this total moves too, live, with no restart involved. |
| Avg Ping | Average round-trip time of this environment's /heartbeat calls to its Agent, computed as total ping time ÷ sync count. |
| Avg Pressure | This environment's buffer occupancy — frames currently buffered ÷ Buffer Max Size, as a percentage. Climbs under sustained load; see Pressure Alert for what happens once it crosses the configured threshold. |
| Hogging Rate | How much faster data is arriving than it's being uploaded, right now — 100 × avg receive rate ÷ avg upload rate, over the current trailing window. A live signal: it reacts within a few sync cycles, unlike Upload Responsiveness below. |
| Upload Responsiveness | Lifetime share of every frame ever captured that has actually made it to the Agent — 100 × total uploaded ÷ total captured, since this environment started. A slow-moving scorecard, not a live signal: it answers "has this environment ever fallen behind and not caught back up," not "is it struggling right now." |
| Agent | The Agent this environment uploads to, with an OK/Down reachability badge. Clicking Down opens the full connection-error detail. |
Hogging Rate vs. Upload Responsiveness
Both describe the same underlying problem — capture outpacing upload — from two different angles. Hogging Rate is the one to watch for "is this happening right now"; Upload Responsiveness is the one to check for "has this environment ever gotten seriously behind, over its whole lifetime." An environment can show a healthy Hogging Rate while still carrying a low Upload Responsiveness from an incident days ago, since the lifetime ratio never resets.
Click a row to jump straight to that environment's scope
Clicking anywhere on an environment's row (outside the Agent reachability badge) switches the left-hand scope to that environment — the same as clicking it directly in the left-hand nav. A View \<Environment> tooltip confirms this on hover.
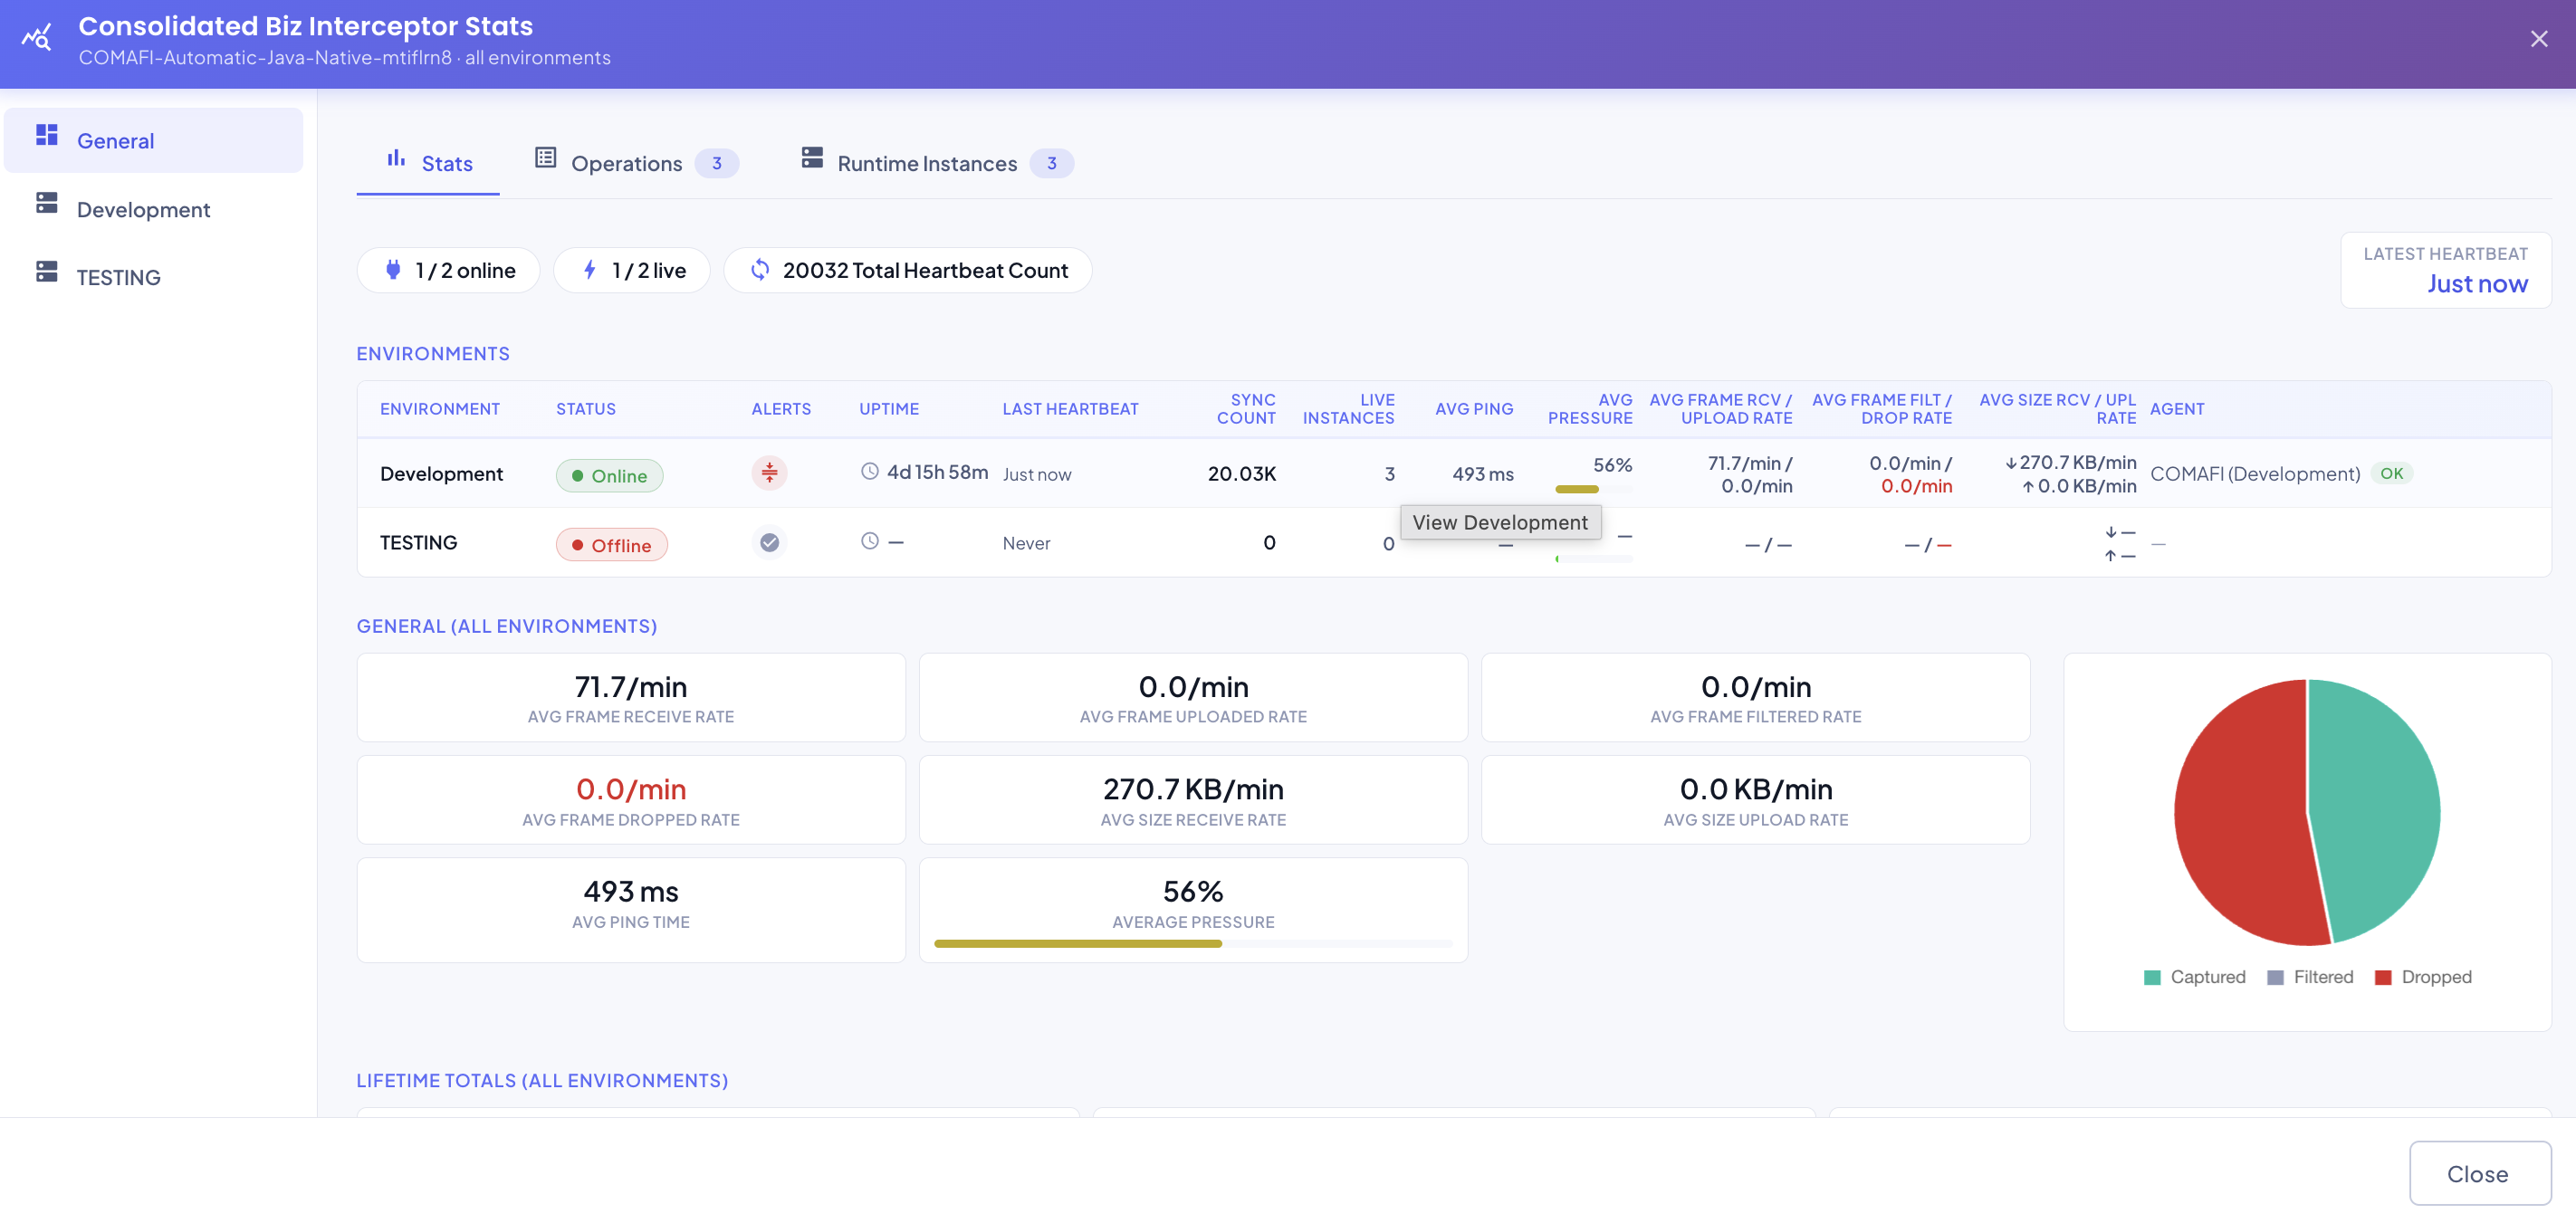
Interceptor Live Trends
Below the Environments table (General scope) or the status cards (single-environment scope), an Interceptor Live Trends section — aggregated metrics for whichever scope is currently selected, shown as tiles alongside each other so they read as one consistent set rather than any single figure standing apart from the rest — plus a Captured/Filtered/Dropped pie chart to the side:
- Avg Frame Receive Rate, Avg Frame Uploaded Rate, Avg Frame Filtered Rate, Avg Frame Dropped Rate — frames per minute, for each of the four counters.
- Avg Size Receive Rate, Avg Size Upload Rate — payload data per minute (KB/min).
- Avg Ping Time, Average Pressure — same meaning as their Environments Table counterparts, rolled up across the current scope.
- Upload Responsiveness, Hogging Rate — same meaning as their Environments Table counterparts above; see the tip there for how the two relate.
- Active Workers — sits right next to Hogging Rate. Same "Workers" total as the Environments Table column above, rolled up to whatever's currently selected: every instance in every environment for the General scope, or just that one environment's own instances for a single-environment tab.
- Transmit Batch Size — sits right next to Active Workers. The sum of every in-scope instance's current effective sync batch size — see Backpressure Auto-Tuning for how each instance's own batch size moves on its own between its configured Initial and Max. A sum, not an average, for the same reason as Active Workers: the combined batch capacity actually in flight right now across every instance in scope is the meaningful number, not a per-instance figure diluted by how many instances happen to be in scope.
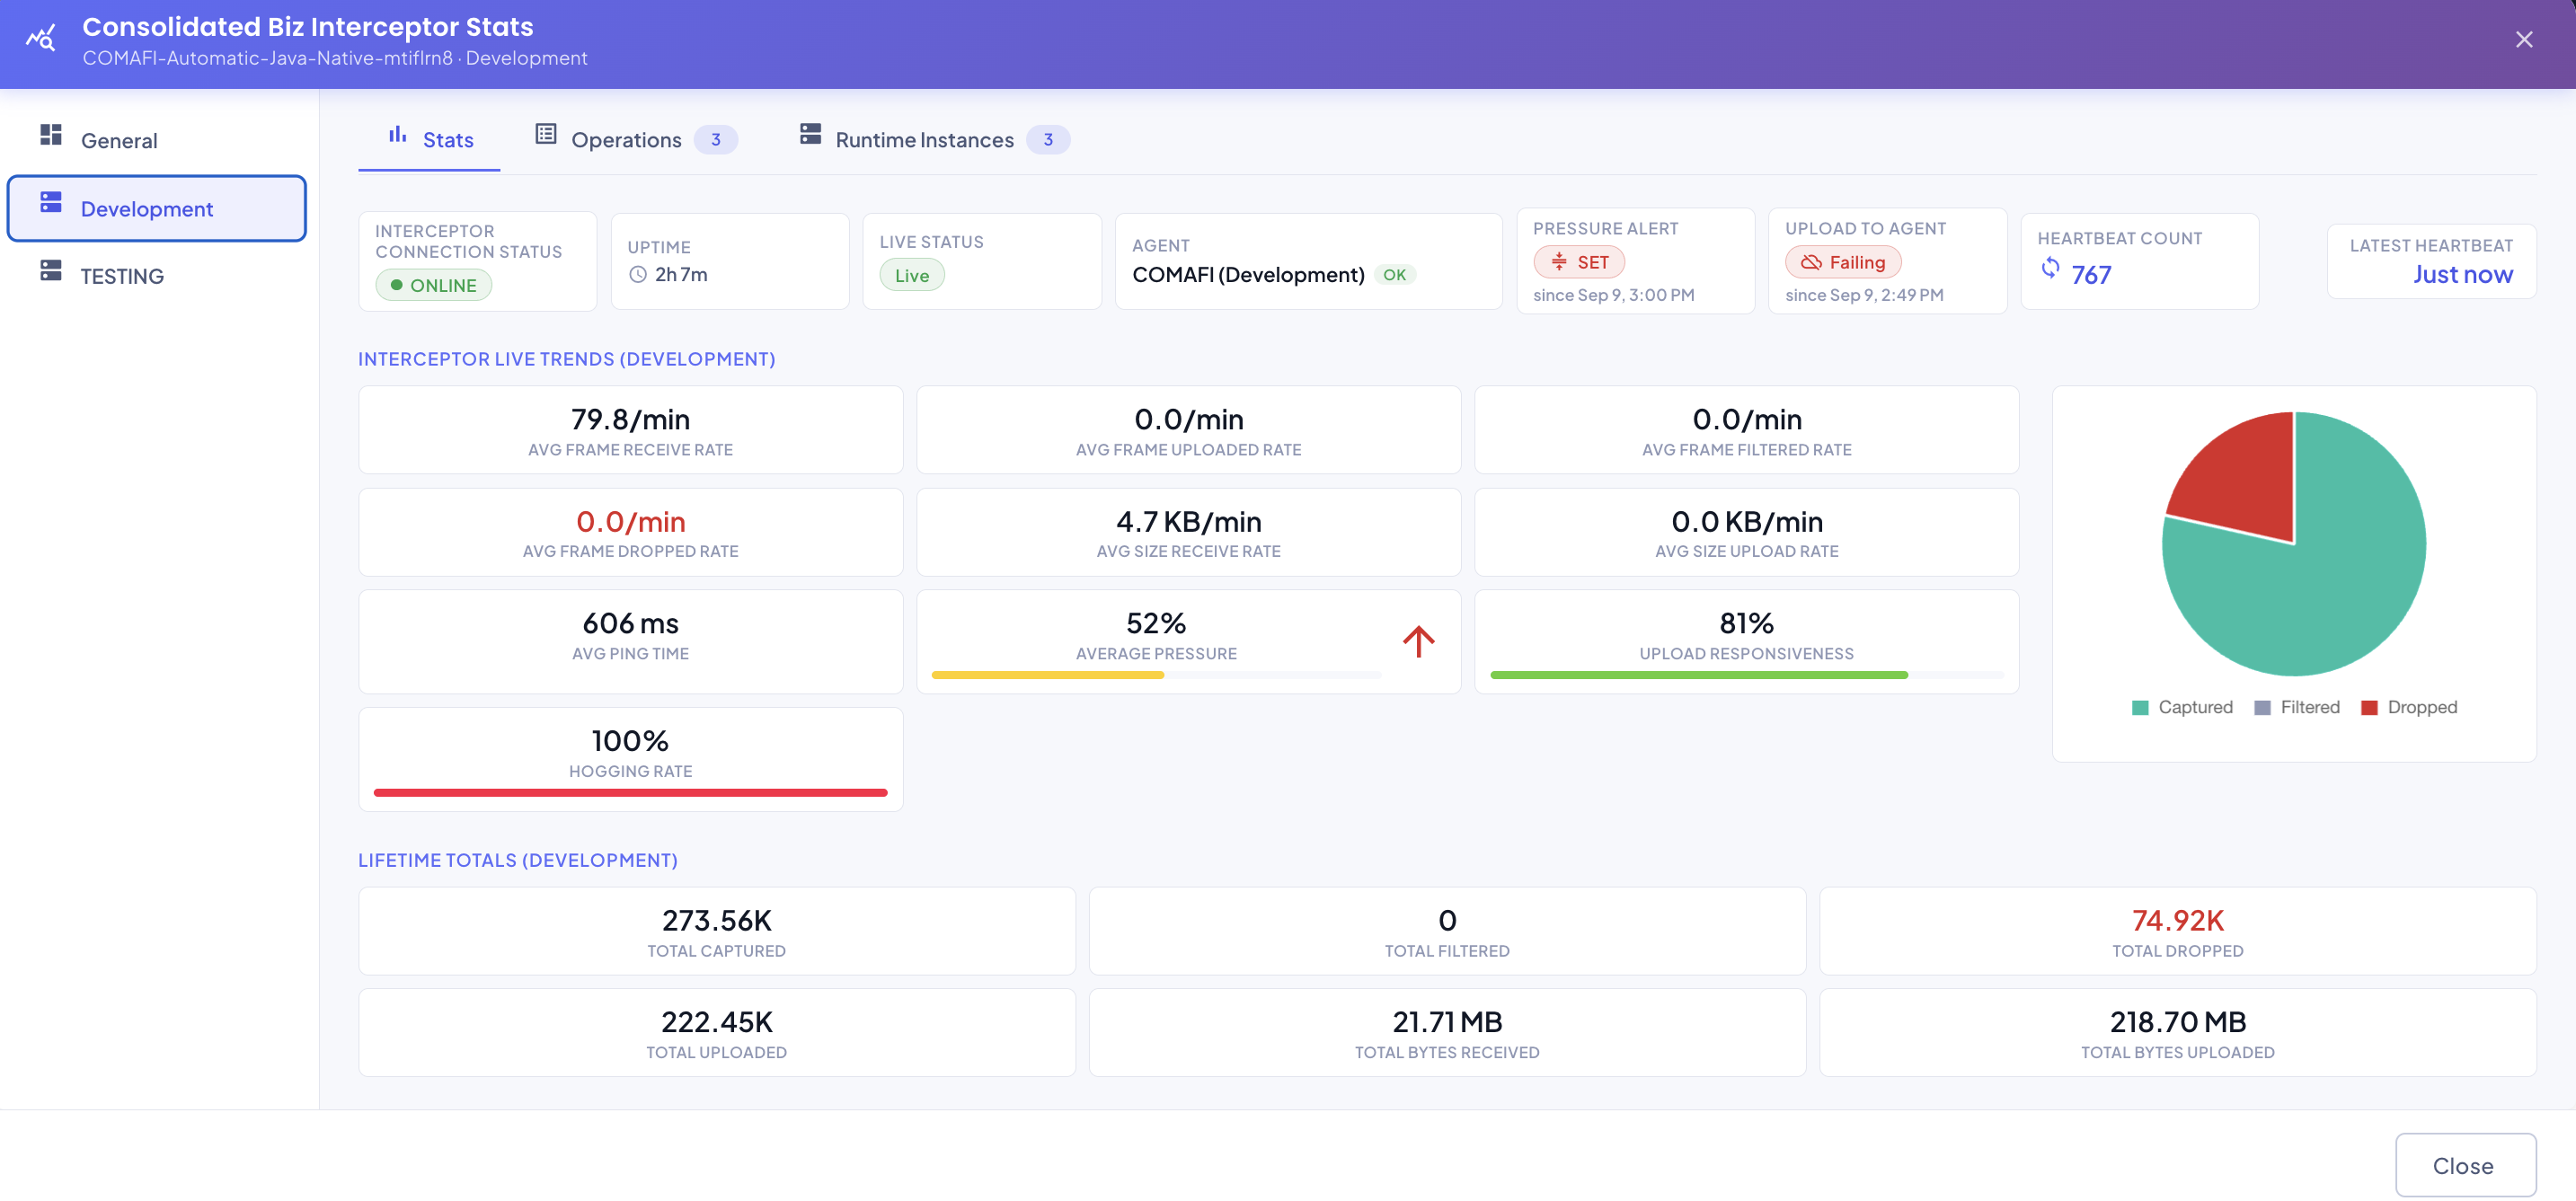
The arrow next to Average Pressure and Hogging Rate
These two tiles can carry a small trend arrow next to the value — (red) when the metric has been climbing over its last several sync cycles, (green) when it's been falling, and no arrow at all when there isn't yet enough history to tell (or it's essentially flat). Rising is always the "worse" direction for both metrics, which is why it's red regardless of which of the two tiles it's attached to.
Judging Interceptor Performance: Pressure, Hogging Rate, and Upload Responsiveness
Of everything on this tab, these three tiles are the ones that actually answer "is this interceptor keeping up?" — each from a different angle, and reading them together tells a fuller story than any one of them alone:
- Average Pressure asks "is it in trouble right now?" It's a direct occupancy gauge on the interceptor's own local buffer — the closer to 100%, the less room is left before newly-captured frames start getting dropped instead of queued. This is the tile to glance at first: a healthy interceptor sits low and flat; one climbing toward 100% is heading for actual data loss, not just a busy period.
- Hogging Rate asks "why is pressure climbing?" It's the ratio of how fast data is arriving versus how fast it's leaving — a high, sustained Hogging Rate means captures are outpacing uploads, which is exactly what fills the buffer in the first place. Watching Pressure and Hogging Rate rise together points at the cause directly: the interceptor isn't failing on its own, it's uploading slower than it's capturing — usually worth checking the Agent's own health or the network path to it next, rather than the interceptor's configuration.
- Upload Responsiveness asks "has this been a chronic problem?" Because it's a lifetime ratio rather than a live rate, it doesn't react to a brief spike the way Pressure and Hogging Rate do — it answers a slower, more durable question: over this environment's entire history, what fraction of everything it ever captured actually made it out? A low Upload Responsiveness on an interceptor that otherwise looks healthy right now (low Pressure, low Hogging Rate) is a sign it fell seriously behind at some point in the past and never fully recovered — worth investigating even when nothing looks wrong at this exact moment.
Put together: Pressure is the alarm, Hogging Rate is the likely reason it's going off, and Upload Responsiveness is the track record that tells you whether this is a one-off or a recurring pattern for this specific environment.
Rate Metrics vs. Lifetime Totals
Most tiles above are an average rate over a trailing window, not a running total — they answer "how much is happening right now," and stay meaningful for an interceptor that's been running for weeks just as well as one that started five minutes ago. A rate can genuinely be 0.0/min (nothing of that kind happened in the window) without that meaning "nothing has ever happened." Upload Responsiveness is the one exception among the tiles above — it's a lifetime ratio like the Lifetime Totals below, not a windowed rate, which is exactly why it moves so much more slowly than everything around it.
For the cumulative, since-this-environment-first-started numbers, see Lifetime Totals just below the tiles:
| Tile | Meaning |
|---|---|
| Total Captured | Every frame captured by this environment since it started, added up. |
| Total Filtered | Every frame filtered out by configuration, added up. |
| Total Dropped | Every frame dropped (buffer overflow, upload failure, etc.), added up. |
| Total Bytes Received | All payload data received, added up. |
| Total Bytes Uploaded | All payload data uploaded, added up. |
Watch Avg Frame Dropped Rate climb with Avg Pressure
Once Avg Pressure holds near 100% for a while, the buffer has no room left for newly-captured frames — Avg Frame Dropped Rate starts climbing right alongside it, and Total Dropped starts accumulating faster. Avg Pressure crossing 100% capacity is the leading indicator; Avg Frame Dropped Rate actually rising above 0.0/min is the confirmation that frames are being lost right now, not just that the buffer is full.