Biz Interceptor Consolidated Stats
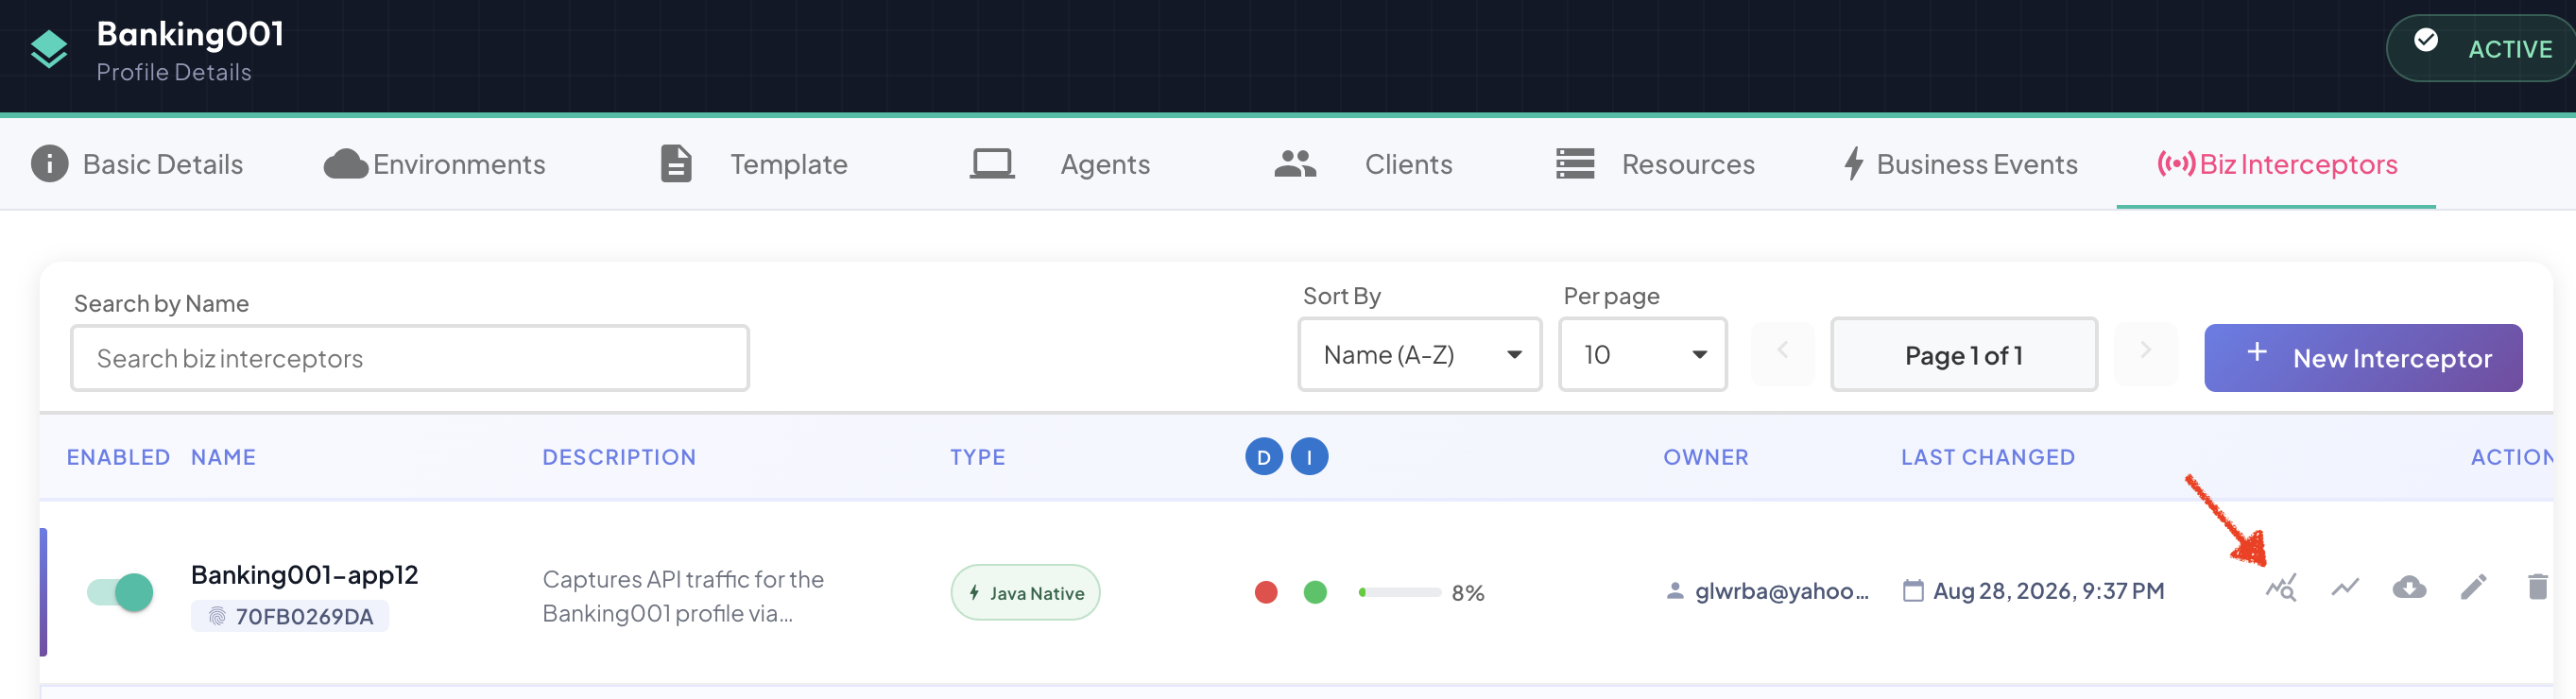
Click the icon on any row of the Biz Interceptor Summary to open Consolidated Biz Interceptor Stats — a live, auto-refreshing view of everything this interceptor has captured, both across all its environments combined and broken down per environment.
This is the main place to actually watch a Biz Interceptor while it's running, not just confirm it's connected — capture/upload/drop rates, buffer pressure, and Agent latency, all live in one dialog instead of scattered across separate screens. Where the Biz Interceptor Summary and Environment Status answer "is it up and healthy right now," Consolidated Stats is what you open to actually monitor traffic as it happens — spotting a struggling environment, a misbehaving endpoint, or a specific instance falling behind, in real time.
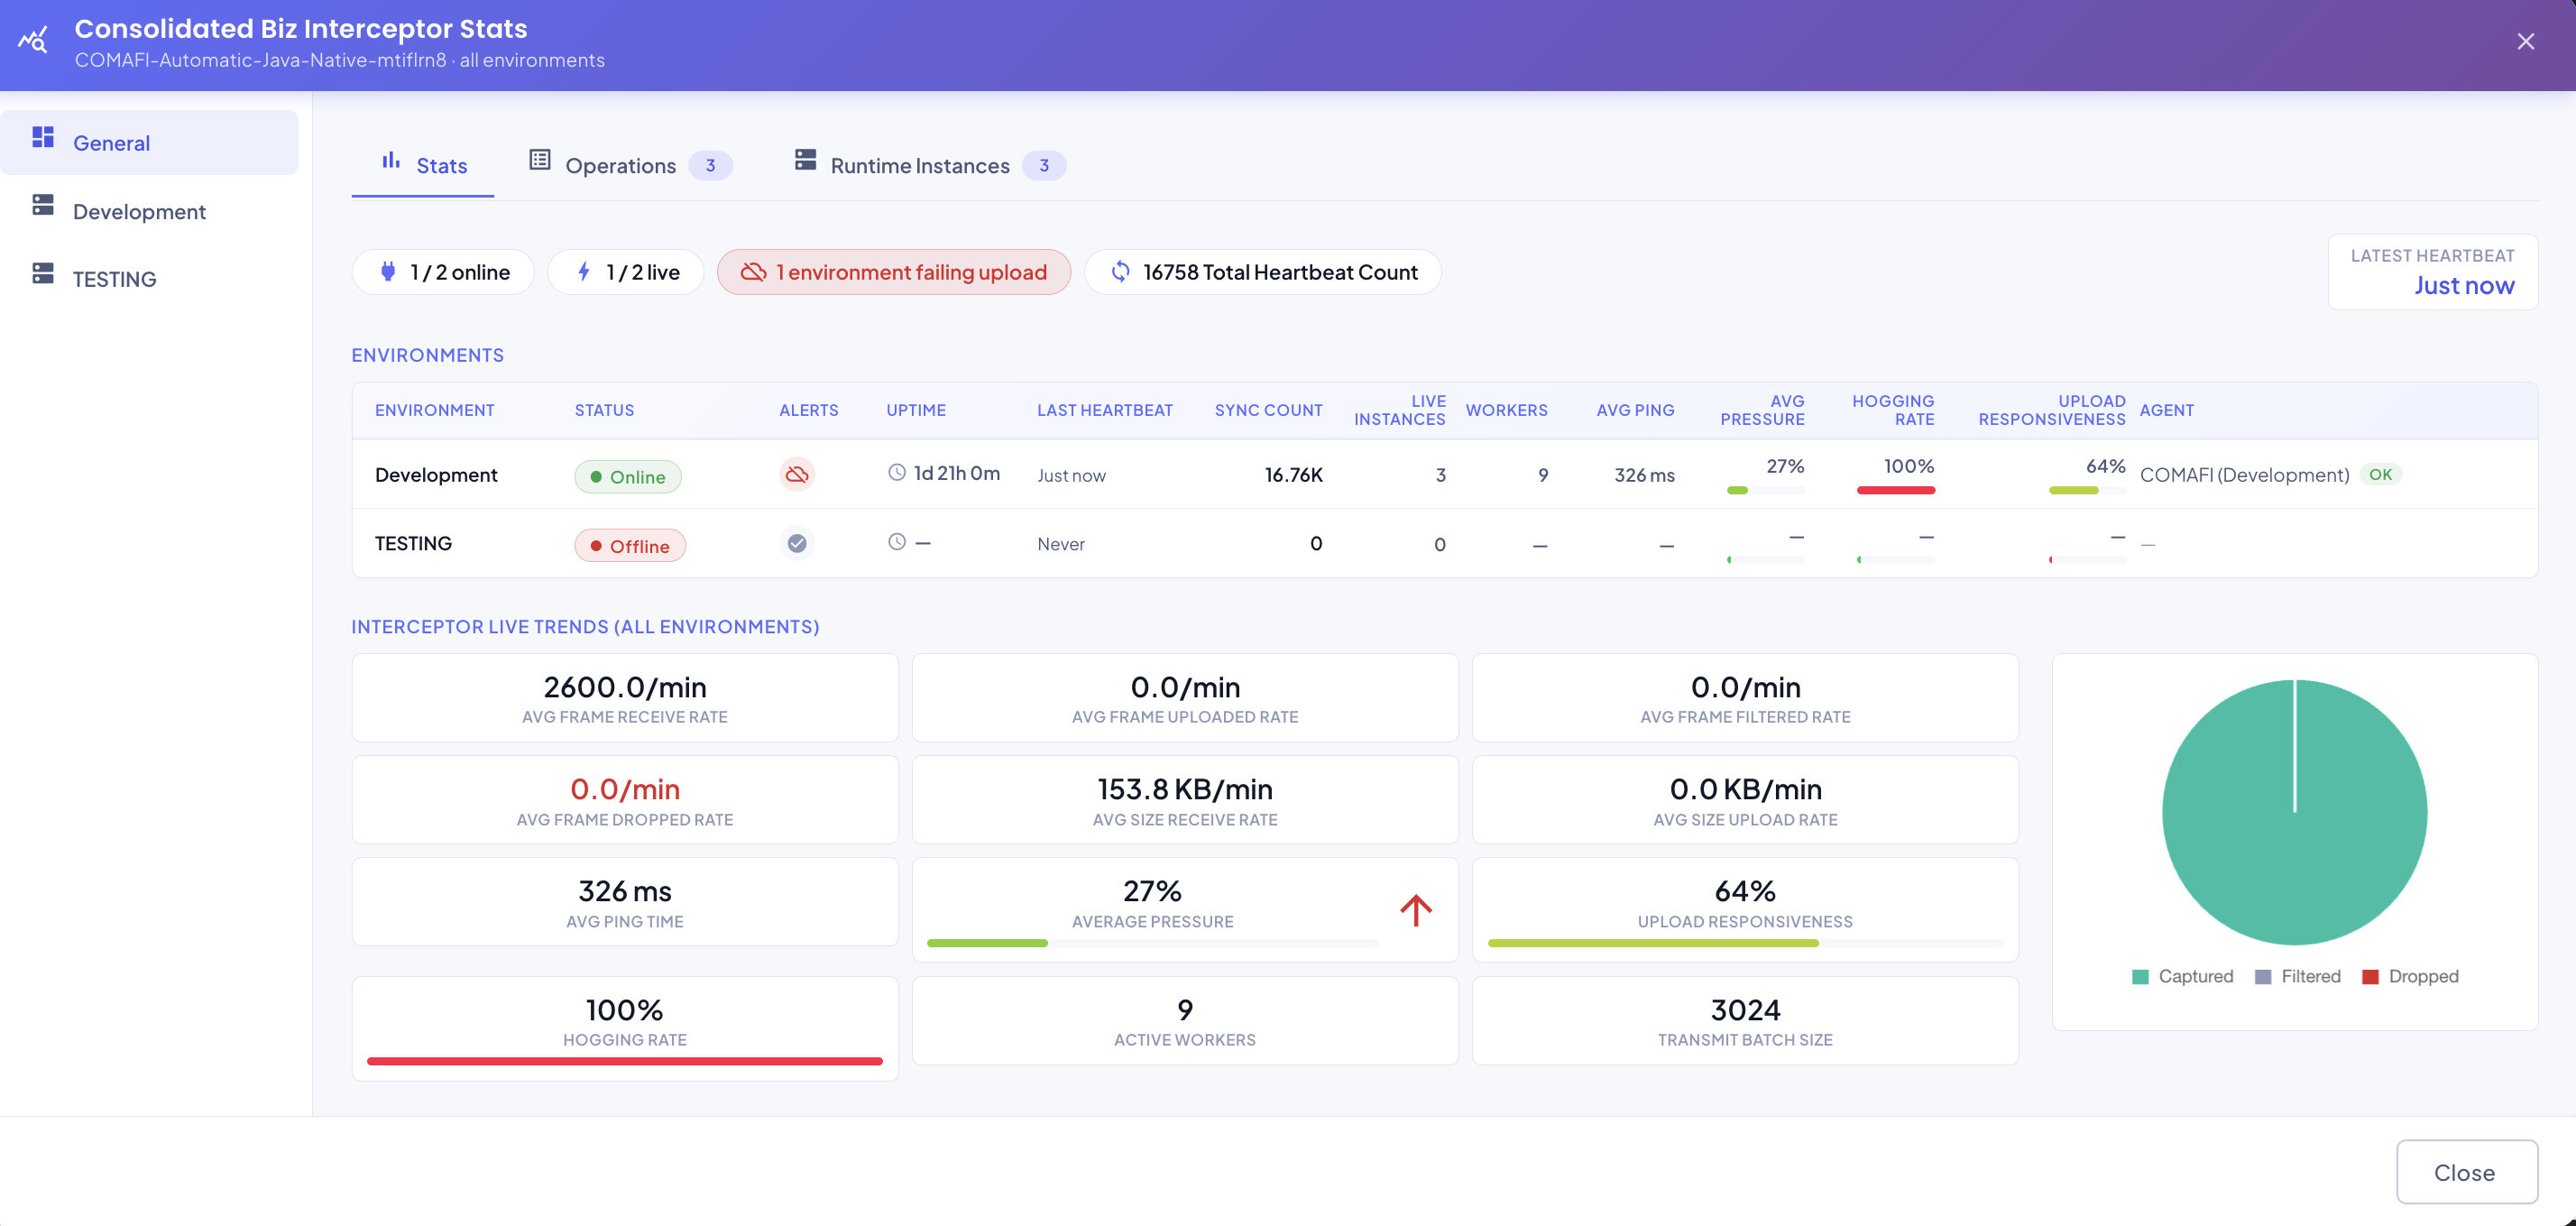
The dialog auto-refreshes on a short interval while it's open, so the numbers stay current without needing to close and reopen it.
Layout
The dialog is organized along two independent axes — a scope on the left, and a tab on the right — and what you see is always both combined at once.
Scope (left-hand vertical nav): either General — every one of this interceptor's environments aggregated together — or one entry per individual environment, showing that environment's own numbers in isolation. Switching scope never changes which tab you're on; it just changes what data that tab is showing.
Tab (top of the right-hand panel): different angles on the same interceptor, each covered on its own page:
- Stats Tab — general runtime statistics for the interceptor: connection status, heartbeat/sync counts, capture totals, pressure, and (on the General scope specifically) the per-environment Environments Table breakdown.
- Operations Tab — statistics broken down by active API endpoint/operation, rather than by environment.
- Discovery Tab — only while Live Discovery Mode is on: every endpoint captured during the latest Discovery capture, flagged as New API, Known or Live. The Stats tab also gains Discovered APIs and Discovered Frames counters.
- Runtime Instances Tab — statistics per individual running instance of the interceptor. Since an interceptor deploys inside the business application itself, there's one instance per running copy of that application — see Interceptor and Business Application Lifecycle for why that count is whatever it is.
Clicking an Environment Status Dot
Clicking a status dot in the Biz Interceptor Summary table opens a focused, single-environment version of this same data:
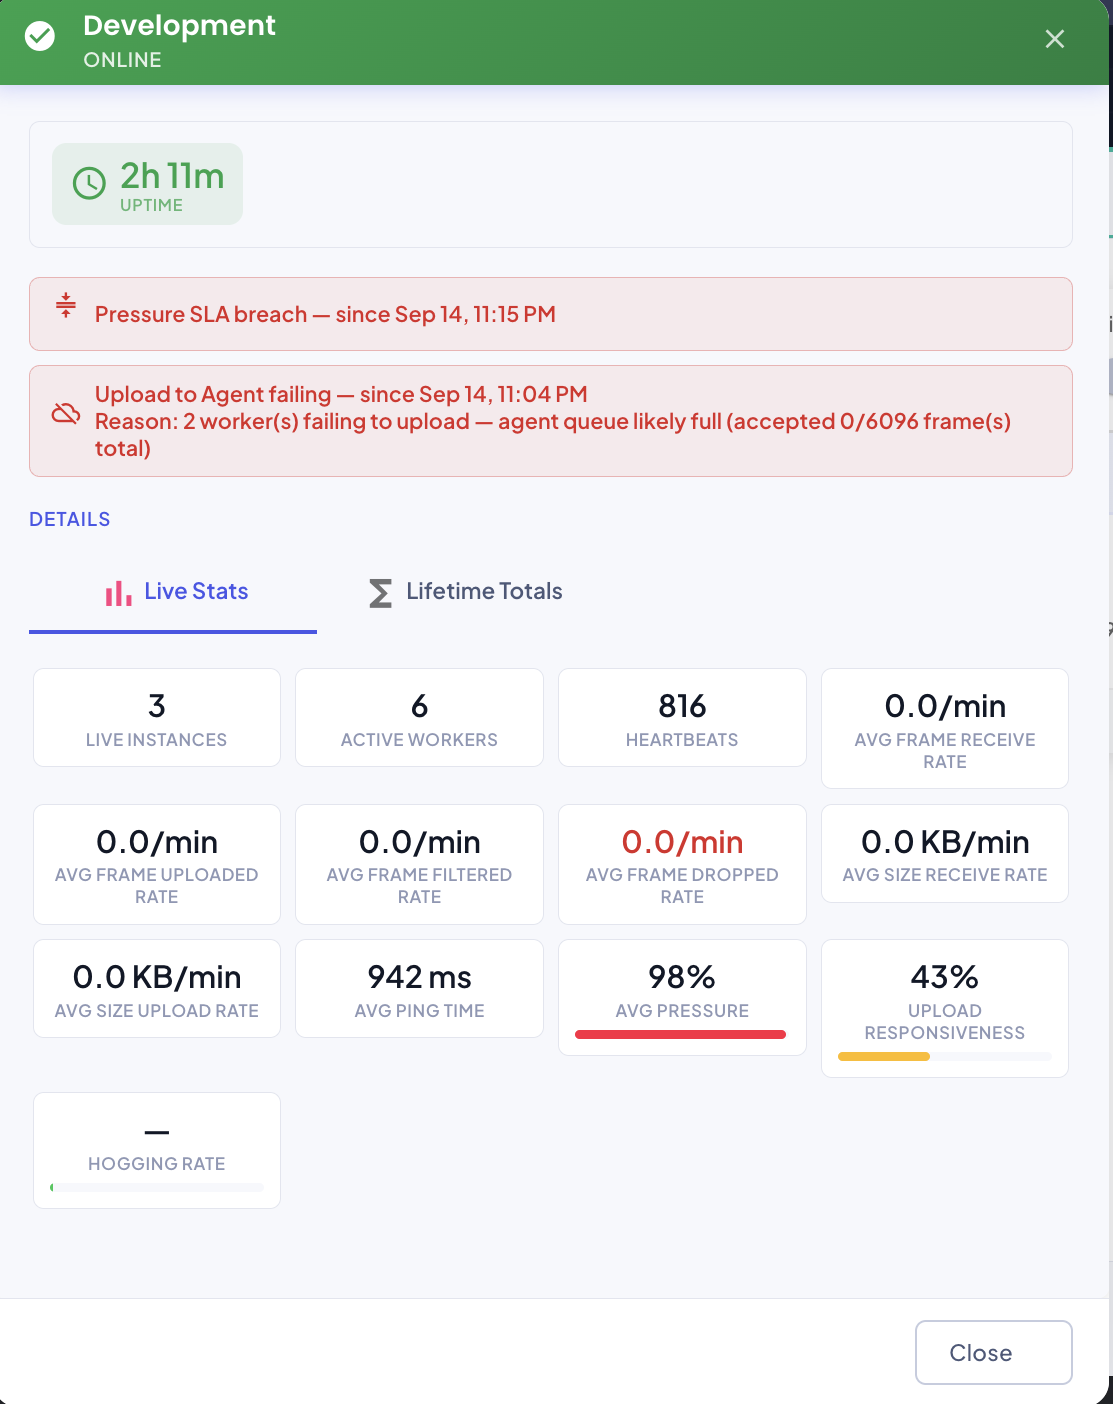
The header shows the current status and, for Online environments, Uptime; below it, a Live Stats tab (Live Instances, Active Workers, Heartbeats, Avg Frame Receive/Uploaded/Filtered/Dropped Rate, Avg Size Receive/Upload Rate, Avg Ping Time, Avg Pressure, Upload Responsiveness, Hogging Rate) and a Lifetime Totals tab (Total Captured, Total Filtered, Total Dropped, Total Bytes Received, Total Bytes Uploaded, plus the Captured/Filtered/Dropped pie chart) — see Rate Metrics vs. Lifetime Totals on the Stats Tab page for the distinction between the two, and Environment Status for the full breakdown of every status's own version of this dialog. For any non-Online status, these tabs are replaced with whatever's actually relevant — the specific reasons for Standby, or the connection error and stack trace for Unreachable. A Pressure Alert/Agent Latency Alert banner and/or a restart-required banner can appear above them regardless of status.