Agent Details
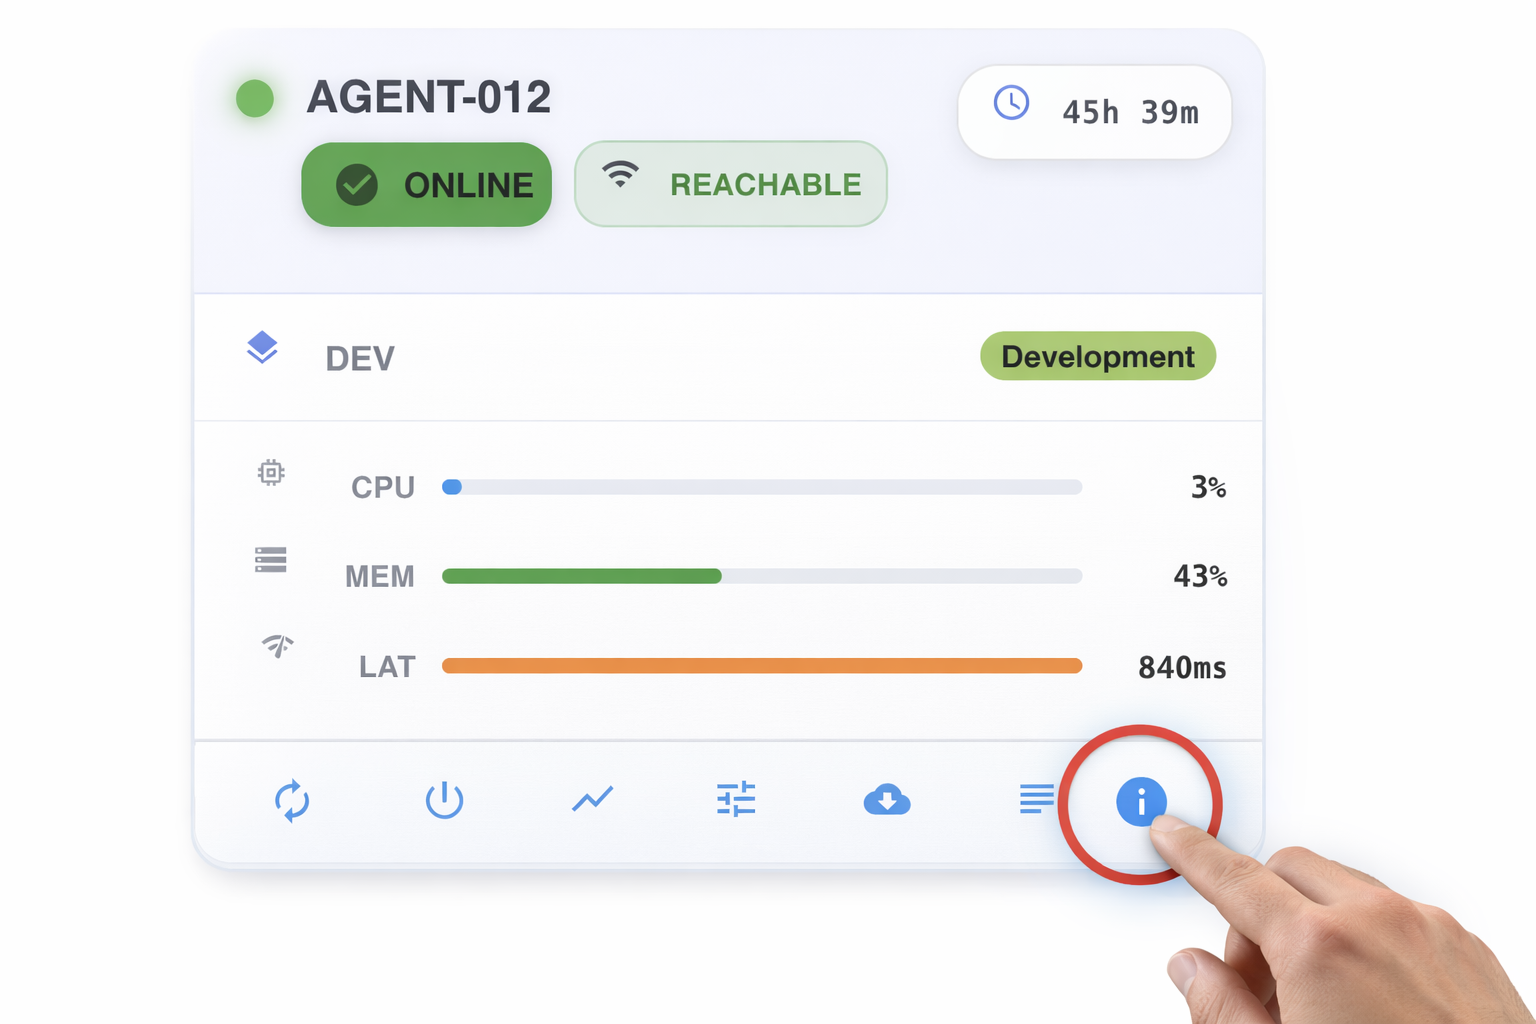
Clicking on any agent card in the Agent Summary opens the Agent Details dialog, which provides a comprehensive view of the agent's runtime information, configuration, and real-time performance metrics.
Alternatively, you can achieve the same goal by clicking on the details icon within the individual agent card's action toolbar.

Pending Changes Banner
When configuration changes have been saved that the running agent has not yet applied, and the agent is online, a banner is displayed at the top of the dialog:
| Banner | Meaning | Action |
|---|---|---|
| Restart Required | Configuration has changed and will take effect after the agent restarts. | Click Restart Now to restart the agent from here. |
| Redeploy Required | Some configuration changes need a full redeploy to take effect — a restart alone won't apply them. | Click Download Agent to get an updated installer, then reinstall the agent. |
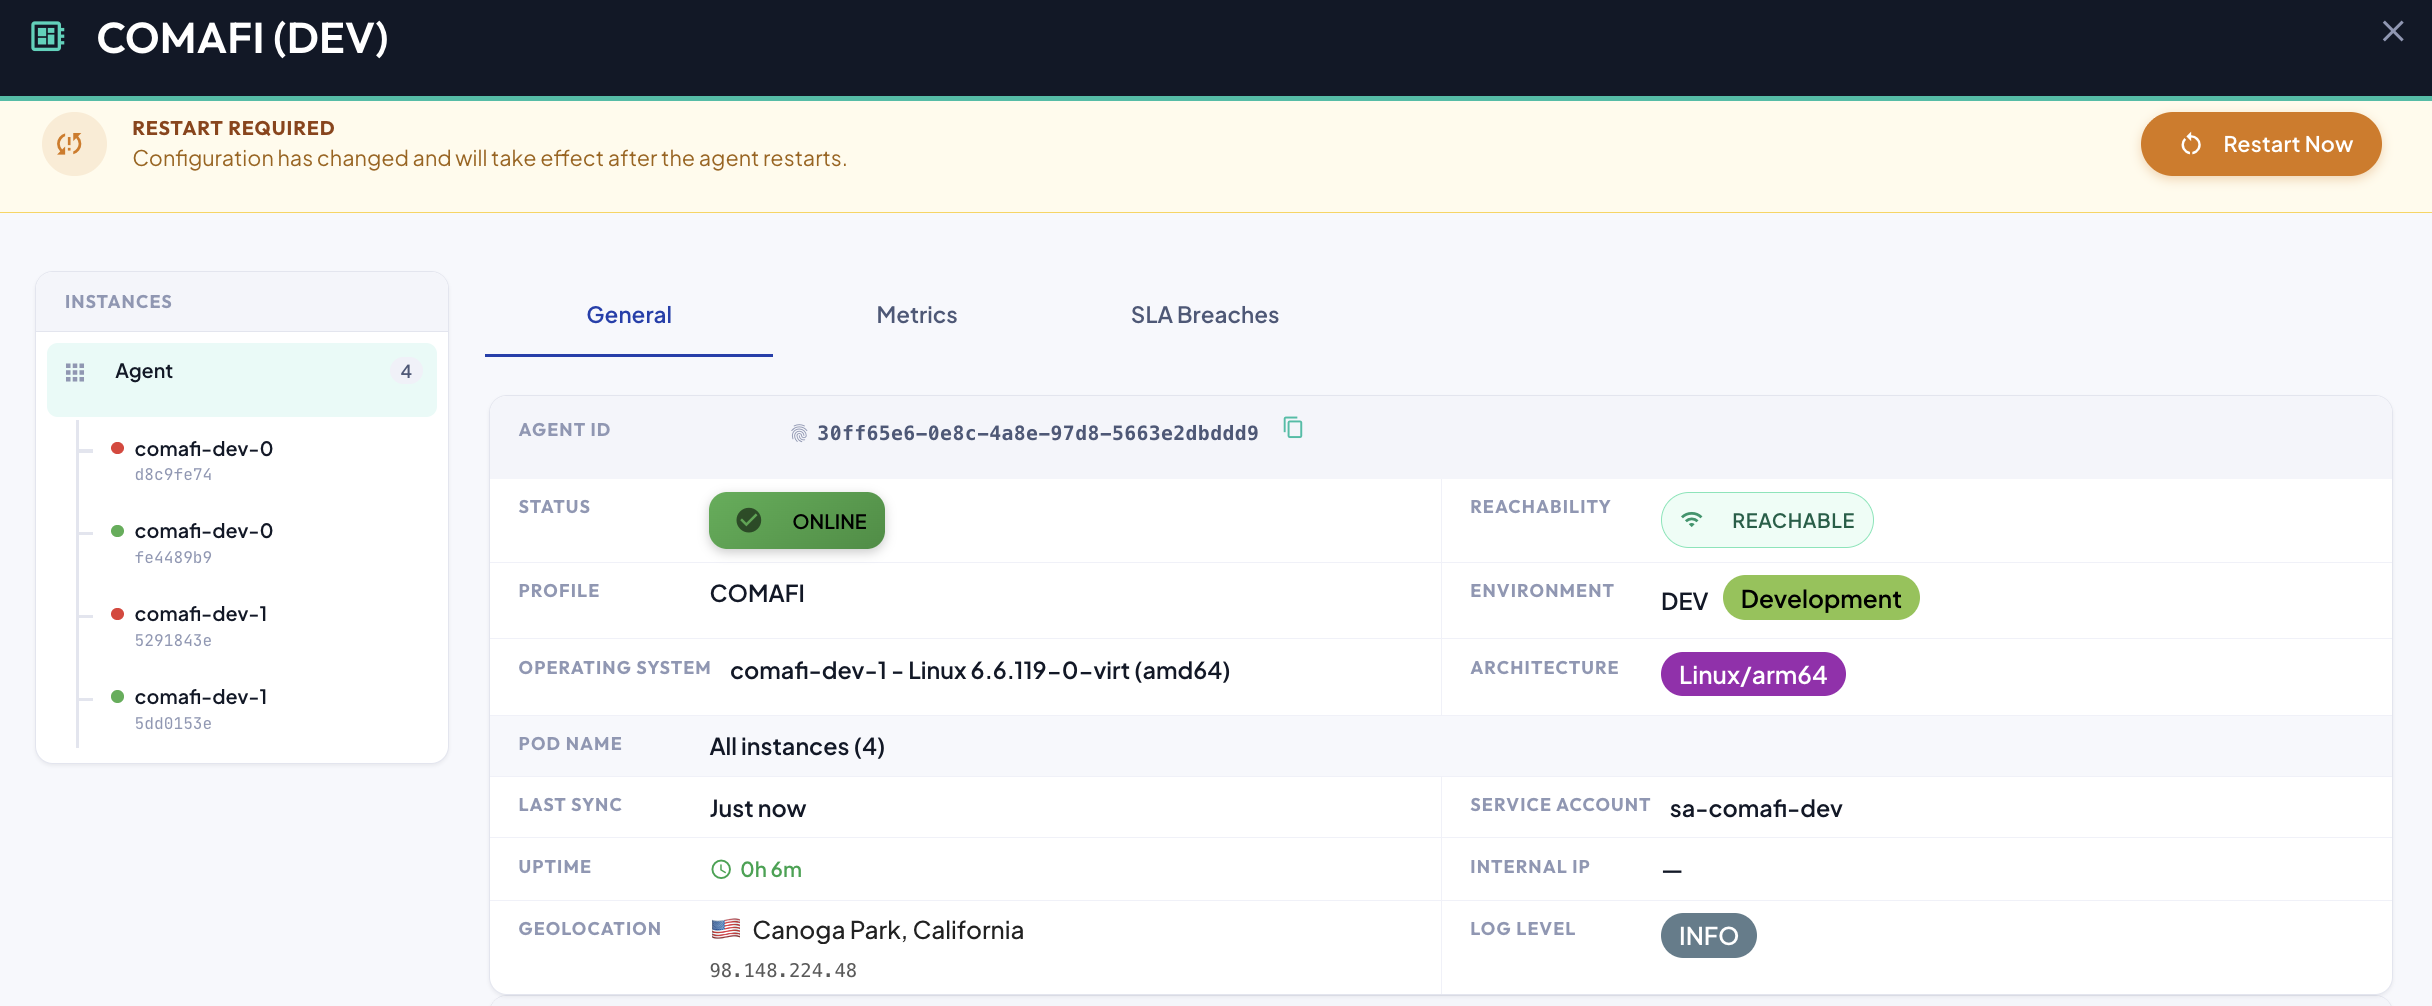
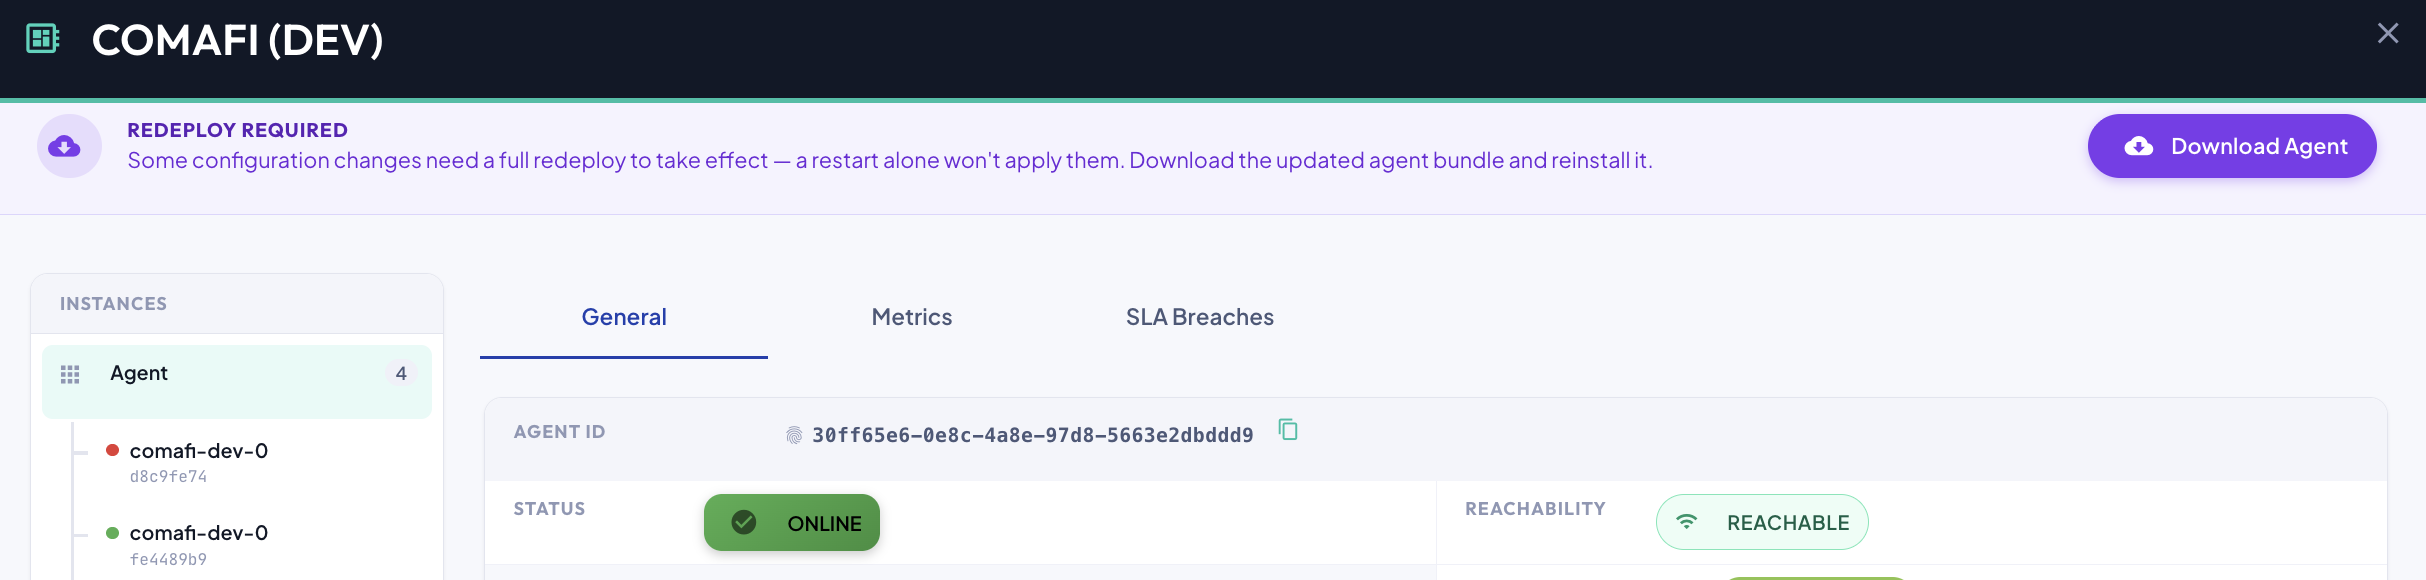
Only one banner is shown at a time: Redeploy Required takes precedence over Restart Required, because a reinstall also restarts the agent. The banner disappears once the pending change has been applied. See Breaking vs Non-Breaking Changes for which settings trigger each one.
Agent Identification
The top section of the dialog displays the core identifying information for the agent:
| Field | Description |
|---|---|
| Agent ID | The unique internal identifier assigned to this agent by BizMetry. |
| Agent Name | The human-readable name identifying the agent. |
| Status | The current operational state of the agent (e.g., ONLINE, OFFLINE, RESTARTING). |
| Reachability | Indicates whether the BizMetry platform can currently reach the agent endpoint. An agent may be ONLINE but temporarily Unreachable if network connectivity is interrupted. |
| Profile | The name of the telemetry profile this agent belongs to. |
| Environment | The name and type of the environment this agent is associated with (e.g., my-uat-env · UAT). |
Instances Panel
When the agent runs as more than one Pod replica (see Capacity Configuration), the left-hand Instances panel lists every replica individually, under an Agent group header showing the total replica count.
By default the dialog shows aggregated data across all instances — the rest of the sections on this page reflect the combined agent, not any one Pod. Clicking a specific instance in the panel scopes every other section (Runtime Information, Gateway Configuration reachability, Performance Metrics) down to that one Pod instead:
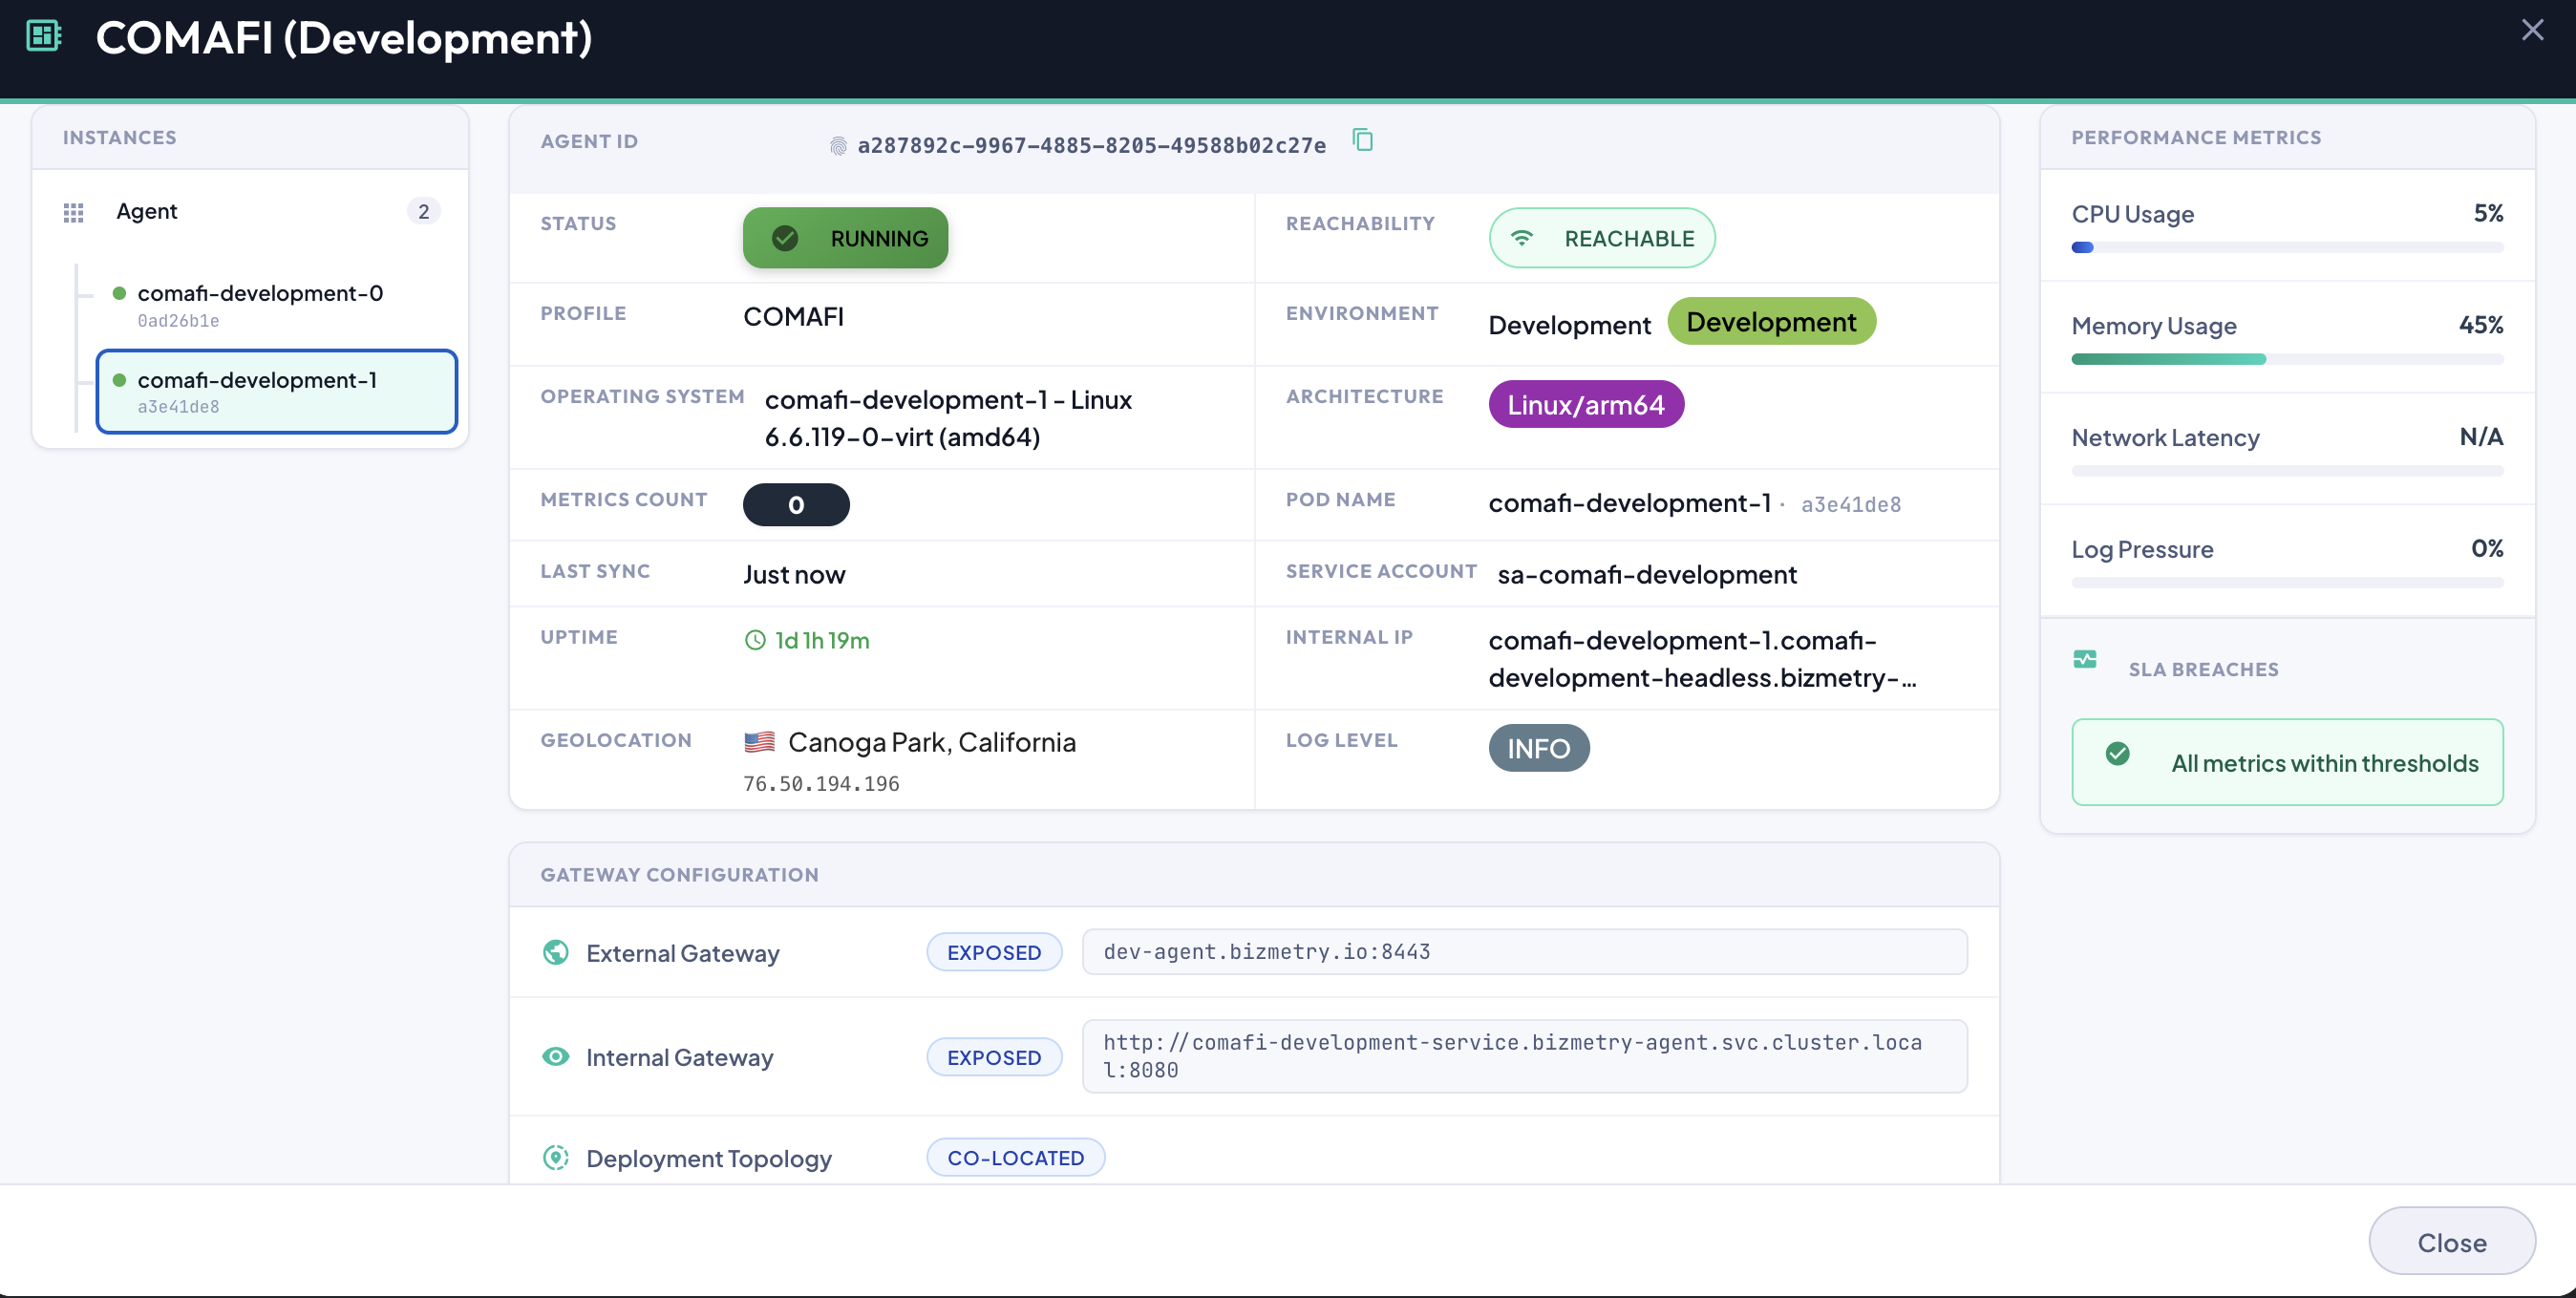
Each instance shows a colored status dot:
| Dot | Status | Meaning |
|---|---|---|
| Running | Heartbeating normally. | |
| Draining | Missed enough consecutive sync cycles to be considered no longer active, but not yet confirmed fully gone — typically a Pod that's mid-restart or about to be replaced. | |
| Drained | Has gone long enough without a sync to be confirmed no longer running. |
An instance moves from Running to Draining, and then from Draining to Drained, purely based on how long it's gone without syncing — independent of whatever the agent's own overall status shows.
Runtime Information
When the agent is ONLINE, the following runtime details are available, reflecting the actual execution context of the agent process:
| Field | Description |
|---|---|
| Operating System | The operating system on which the agent is running (e.g., Linux, Windows Server 2022). |
| Architecture | The processor architecture of the host machine (e.g., amd64, arm64). |
| Uptime | The amount of time the agent has been continuously running since its last startup (e.g., 4h 32m). Resets to zero each time the agent is restarted. |
| Last Sync | Timestamp of the last successful synchronization between the agent and the BizMetry platform. During synchronization, the agent exchanges logs, metrics, and configuration updates. |
| Metrics Processed | The total number of business metrics captured and processed by the agent since its last startup. |
| Service Account | The service account configured for authenticating the agent with the BizMetry platform. |
| Log Level | The current logging verbosity level configured for the agent (e.g., INFO, DEBUG, WARN, ERROR). Higher verbosity levels are useful for troubleshooting but may impact performance. |
Gateway Configuration
Agents communicate with both the BizMetry platform and the customer's internal applications through two independently configured gateways:
External Gateway
| Field | Description |
|---|---|
| URL | The connection endpoint for the external gateway. |
| Status | Whether the external gateway is reachable and operational. |
The external gateway is used by the BizMetry platform to reach the agent from outside the customer's network. This is typically the URL of an external load balancer or reverse proxy exposed to the internet.
Warning
If the external gateway is not configured or unreachable, BizMetry will not be able to communicate with the agent, push configuration updates, or retrieve collected data.
Internal Gateway
| Field | Description |
|---|---|
| URL | The connection endpoint for the internal gateway. |
| Status | Whether the internal gateway is reachable and operational. |
The internal gateway is used by business applications running within the customer's network to reach the agent and submit metrics — either via auto-instrumentation or the BizMetry SDK. This is typically the URL of an internal load balancer or service endpoint.
Warning
If the internal gateway is not configured, business applications will not be able to deliver metrics to the agent, regardless of the agent's operational status.
Deployment Topology
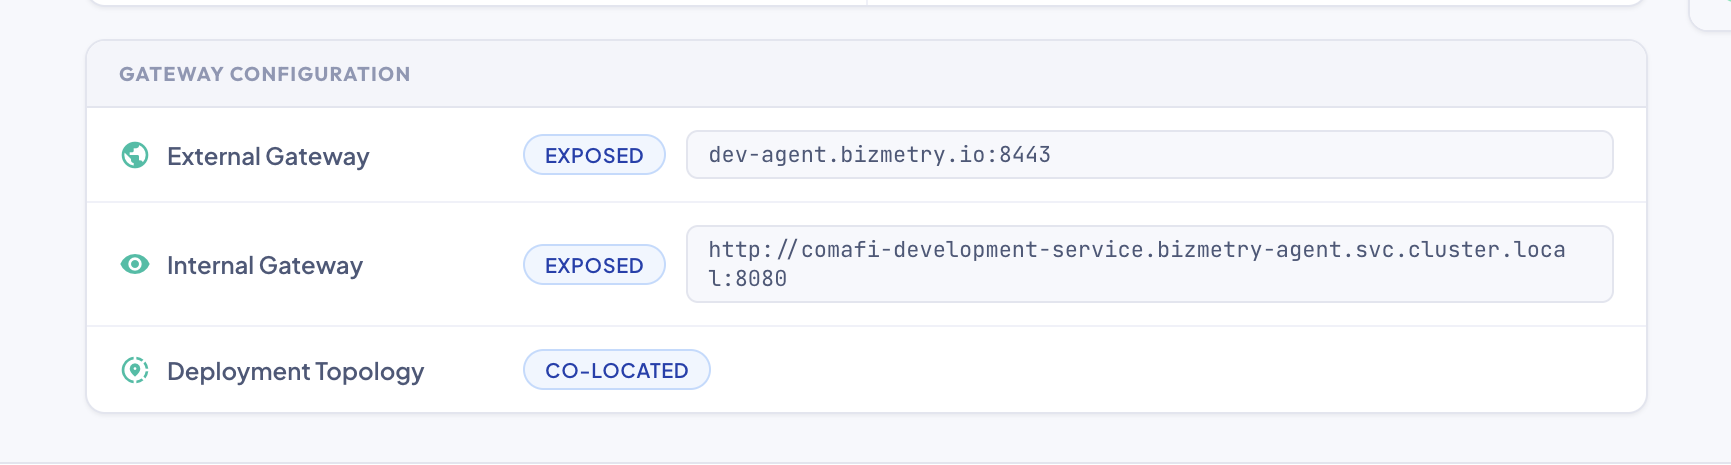
Only shown when the agent is Internally Exposed, this pill mirrors the Agent Deployment Topology choice made in Security Internal configuration — see Understanding Agent Deployment Topology for the full trade-offs between the two:
| Pill | Meaning |
|---|---|
| CO-LOCATED | The agent and the instrumented applications run in the same cluster. The Internal Gateway URL above is computed automatically from the agent's Kubernetes Service and namespace, and uses plain (non-TLS) traffic — see the note below. |
| DECENTRALIZED | The agent runs in a different cluster than the instrumented applications. The Internal Gateway URL above is the manually configured Ingress address, reached over TLS. |
Why a Co-located Internal Gateway URL starts with http://
When the agent and the interceptor share a cluster, traffic to the Internal Gateway never leaves the cluster network, so there's nothing to terminate TLS on for this hop — the URL points straight at the agent's internal Kubernetes Service (e.g. http://<agent>-service.<namespace>.svc.cluster.local:8080) instead of an Ingress hostname. A Decentralized agent's Internal Gateway URL uses https:// instead, since that traffic does cross into a different cluster over the Ingress load balancer.
Real-Time Performance Metrics
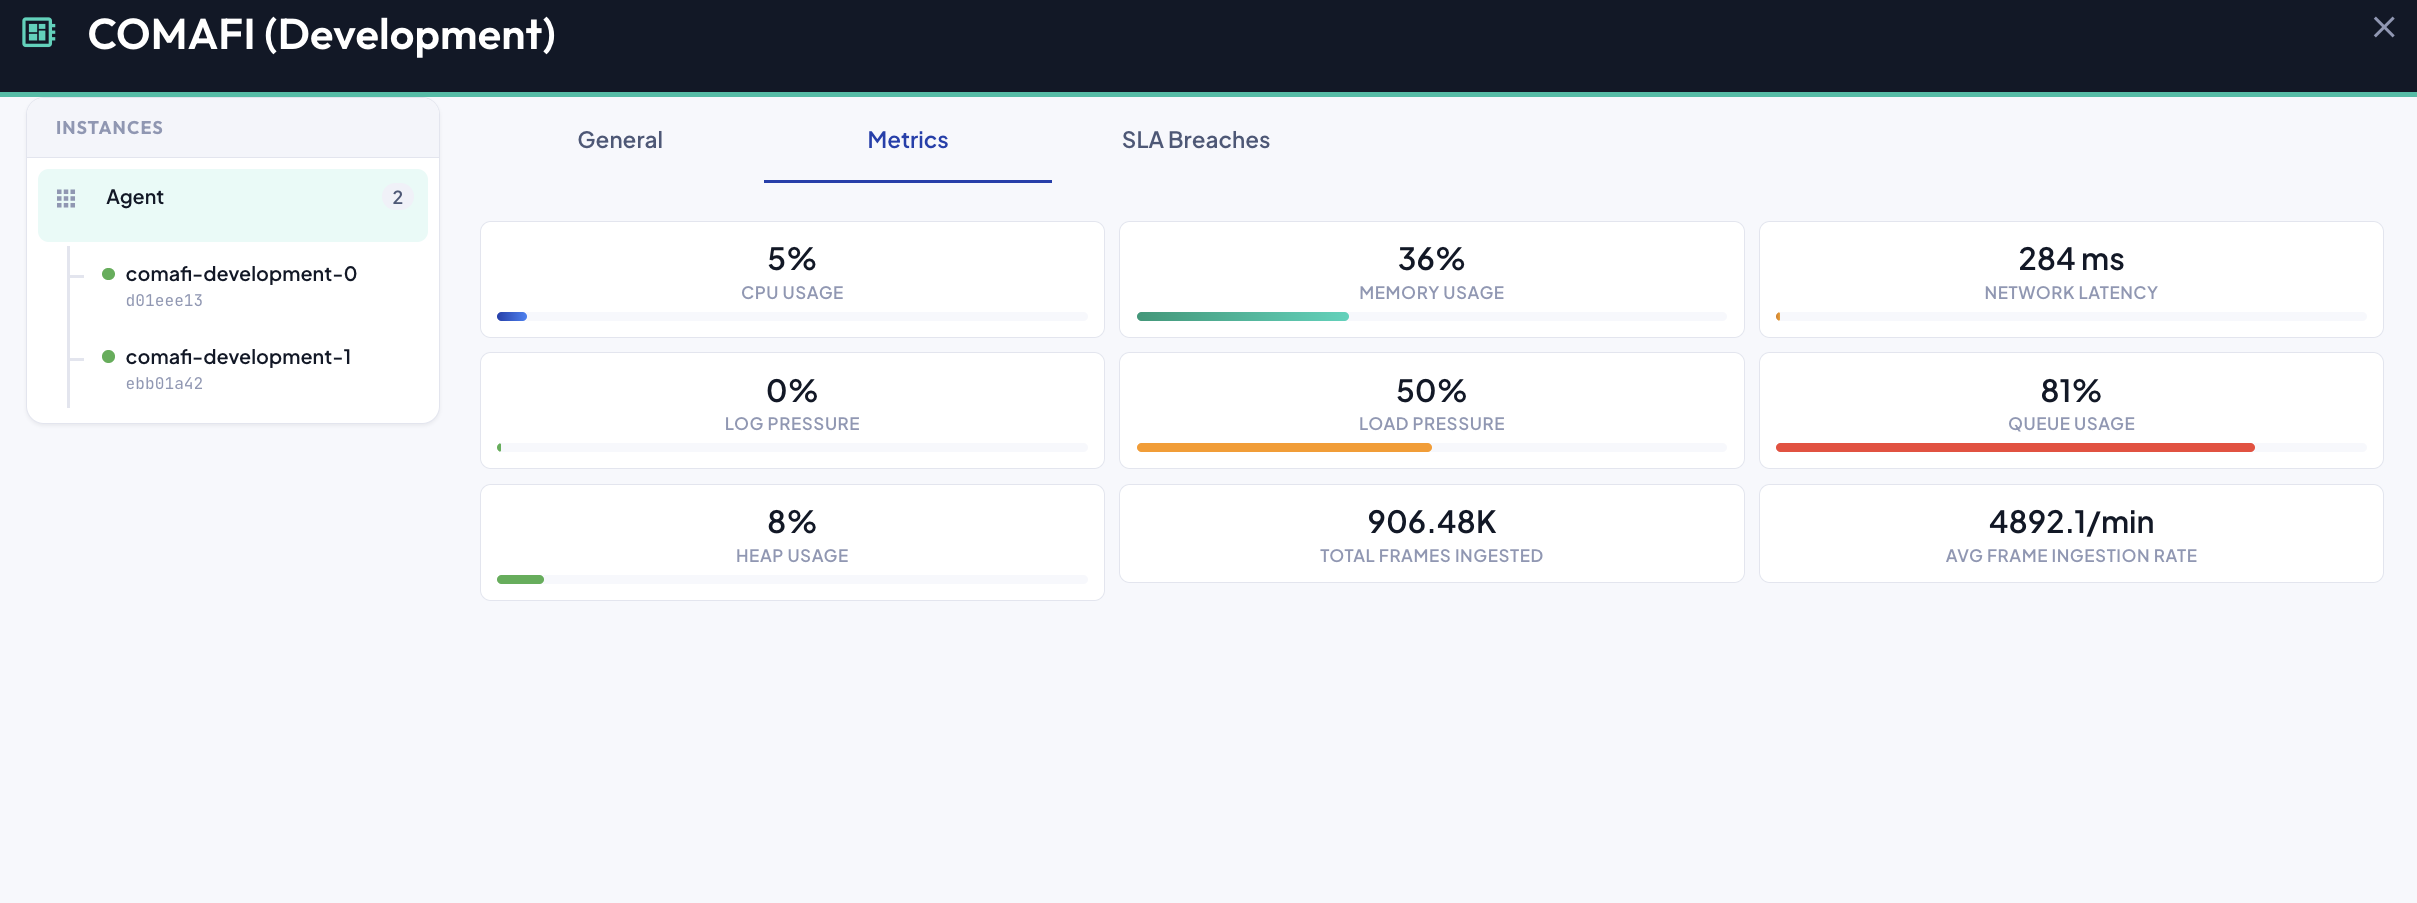
The details dialog displays live resource usage metrics for the agent process, automatically refreshed at regular intervals to ensure the information remains current:
| Metric | Description |
|---|---|
| CPU Usage | Average CPU consumption of the agent process as a percentage of available processing capacity. |
| Memory Usage | Average memory consumed by the agent process as a percentage of available system memory. |
| Network Latency | Average network round-trip time between the agent and the BizMetry platform, measured in milliseconds. |
| Log Pressure | How full the agent's internal log buffer currently is, as a percentage. High values may indicate a logging bottleneck — see Logging Configuration. |
| Load Pressure | How full the agent's metrics-delivery capacity currently is, as a percentage. It is derived from the buffer sizes set in Capacity Configuration and the forwarder settings in Auto-Scaling. This is the same metric configured as Pressure on the SLAs tab: a value sustained near 100% means the agent starts rejecting whole batches from the interceptors uploading to it. |
| Queue Usage | How full the agent's metric buffer is, as a percentage of the capacity set in Metrics Frame Buffer Capacity — one of the two factors averaged into Load Pressure. |
| Heap Usage | How much of the queue's allotted in-memory heap is currently occupied, as a percentage — the other factor averaged into Load Pressure. |
| Total Frames Ingested | The cumulative number of frames the agent has accepted from interceptors since its last startup. |
| Avg Frame Ingestion Rate | The rate at which the agent is currently accepting frames from interceptors, in frames per minute. |
Note
Performance metrics are refreshed periodically in the background. The timestamp of the last update is displayed alongside the metrics.
SLA Breaches
The SLA Breaches section appears in the Agent Details dialog when one or more SLA thresholds configured for the agent are currently being exceeded. If all SLAs are within their defined limits, this section is not shown.
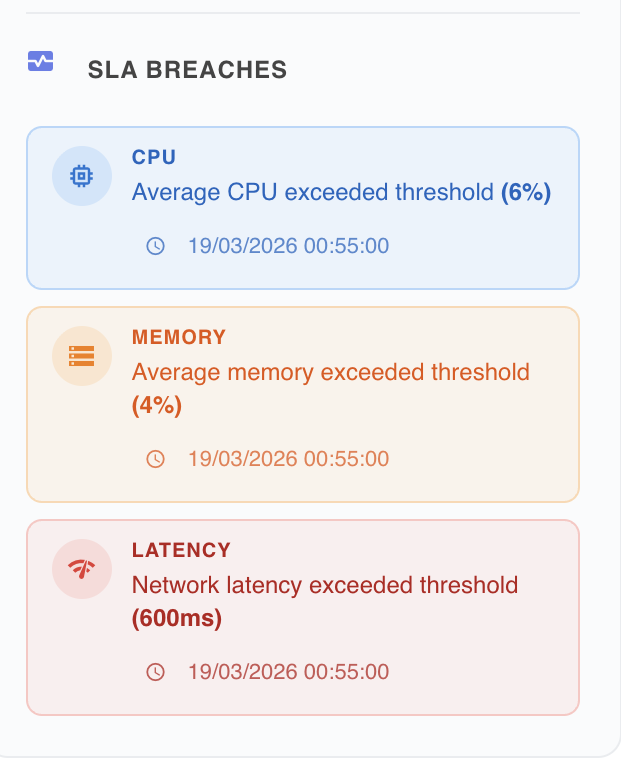
Each active breach is displayed as an individual entry containing the following information:
| Field | Description |
|---|---|
| Resource | The metric that triggered the breach: CPU, Memory, Network Latency, or Pressure. |
| Detected At | The timestamp at which BizMetry detected the breach condition for this resource. |
How breaches are detected and resolved
BizMetry evaluates SLA conditions periodically for each agent. A breach is triggered when a resource metric remains above the configured SET threshold for longer than the configured Set Time window. The breach entry appears in this section as soon as the condition is confirmed.
A breach is automatically resolved — and its entry removed from this section — when the metric drops below the CLEAR threshold and remains there for the duration of the configured Reset Time window. No manual action is required.
Tip
The use of separate SET and CLEAR thresholds, combined with time windows, implements a hysteresis mechanism that avoids false positives and prevents alert flapping caused by transient resource spikes.
Note
SLA thresholds and time windows are configured per agent in SLA Configuration.
Summary
The Agent Details dialog provides:
- Full identification of the agent including its unique ID, associated profile and environment.
- Runtime context including operating system, architecture, and last synchronization timestamp.
- Operational configuration including service account, log level, and metrics processed count.
- Gateway status for both the external (platform-facing) and internal (application-facing) endpoints, plus the agent's Deployment Topology (Co-located vs. Decentralized) when internally exposed.
- Live performance data including CPU, memory, network latency, log pressure, load pressure (and its queue usage / heap usage breakdown), and frame ingestion, refreshed automatically.
- Active SLA breach alerts for any resource currently exceeding its configured thresholds.