Agent Monitoring
BizMetry continuously collects statistical and performance telemetry from every deployed agent. This data is aggregated at the agent level and transmitted to the platform with each synchronization cycle, giving operators a detailed, time-based view of agent health across all environments.
Seven core metrics are tracked per agent:
- CPU usage — processor utilization sampled at regular intervals, consolidated and aggregated before transmission. Provides a clear view of the agent's computational load over time.
- Memory usage — total memory consumption sampled and aggregated in the same way as CPU. Useful for detecting memory pressure or gradual leaks.
- Network latency — the round-trip time between the platform and the agent, measured to determine total network latency. Collected and aggregated at the agent, then transmitted to the platform with each sync.
- Log pressure — how full the agent's internal log buffer is, as a percentage. A rising trend can indicate a logging bottleneck.
- Pressure — how full the agent's metrics-delivery capacity is, as a percentage. The same metric configurable under Pressure SLA, and the one that governs whether the agent accepts or rejects incoming upload batches. It's the average of the two factors below. See Understanding Backpressure Compensation for how the agent adapts its capacity to it.
- Queue Usage — one of the two factors behind Pressure: how full the agent's metric buffer is, as a percentage of the capacity set in Metrics Frame Buffer Capacity — see Auto-Scaling for the related forwarder settings.
- Heap Usage — the other factor behind Pressure: how much of the queue's allotted in-memory heap is currently occupied, as a percentage.
Accessing Agent Metrics
To open the monitoring view for a specific agent, navigate to the Profile, open the secondary menu, and select Agents. Locate the agent in the list, then click the Stats button on its row.
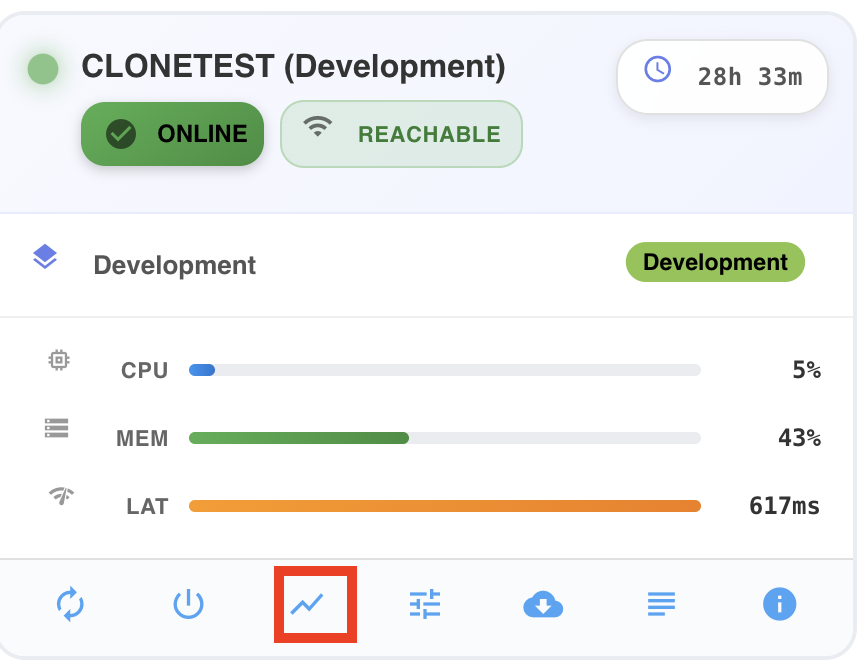
The Agent Monitoring dialog will open, displaying a histogram with all available metrics plotted along a configurable time axis.

Dialog Sections
1. Metrics Timeline
The top section of the dialog displays the main histogram and a live monitoring toggle.
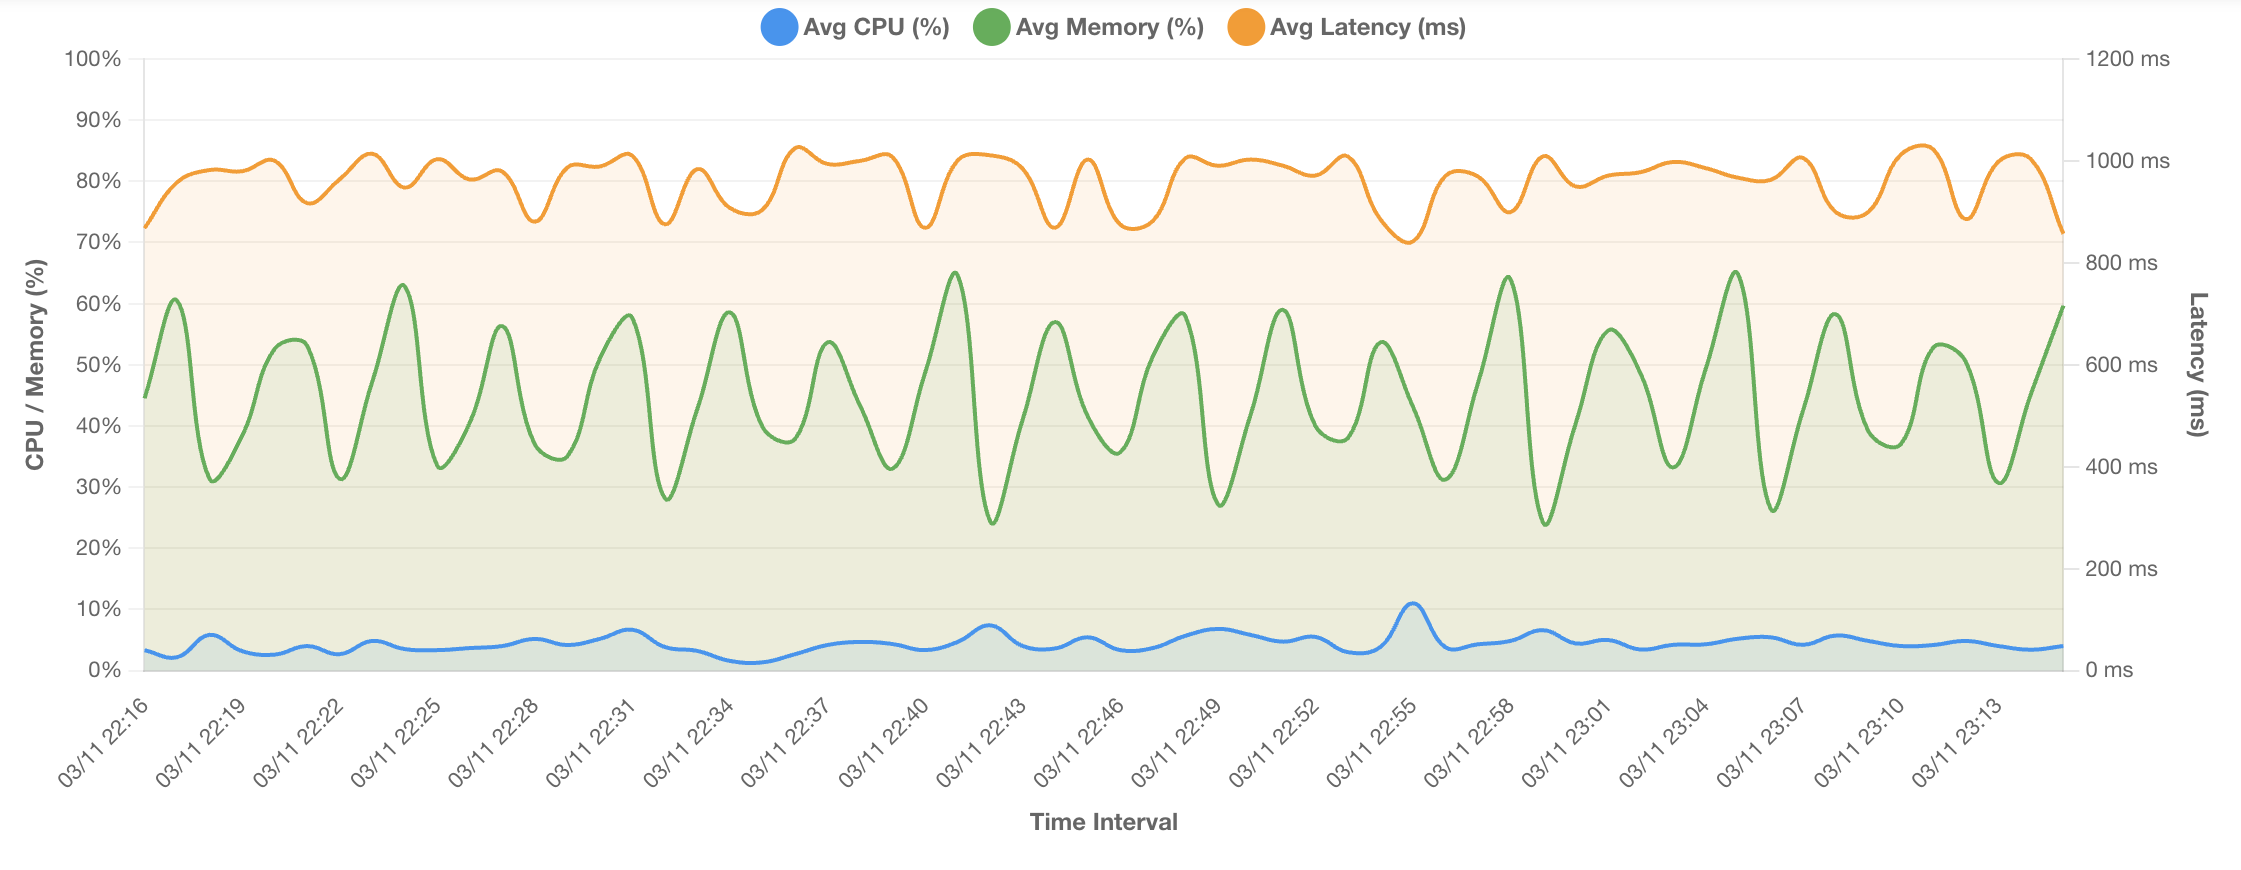
The histogram uses two vertical scales:
- Left axis — percentage scale (0–100) for CPU, memory, log pressure, pressure, queue usage, and heap usage.
- Right axis — millisecond scale for network latency.
And one Horizontal Axis ,representing the time scale.
An information panel above the histogram shows the total number of sample points retrieved for the current query.
You can hover over individual data points in the histogram to inspect their values in detail.
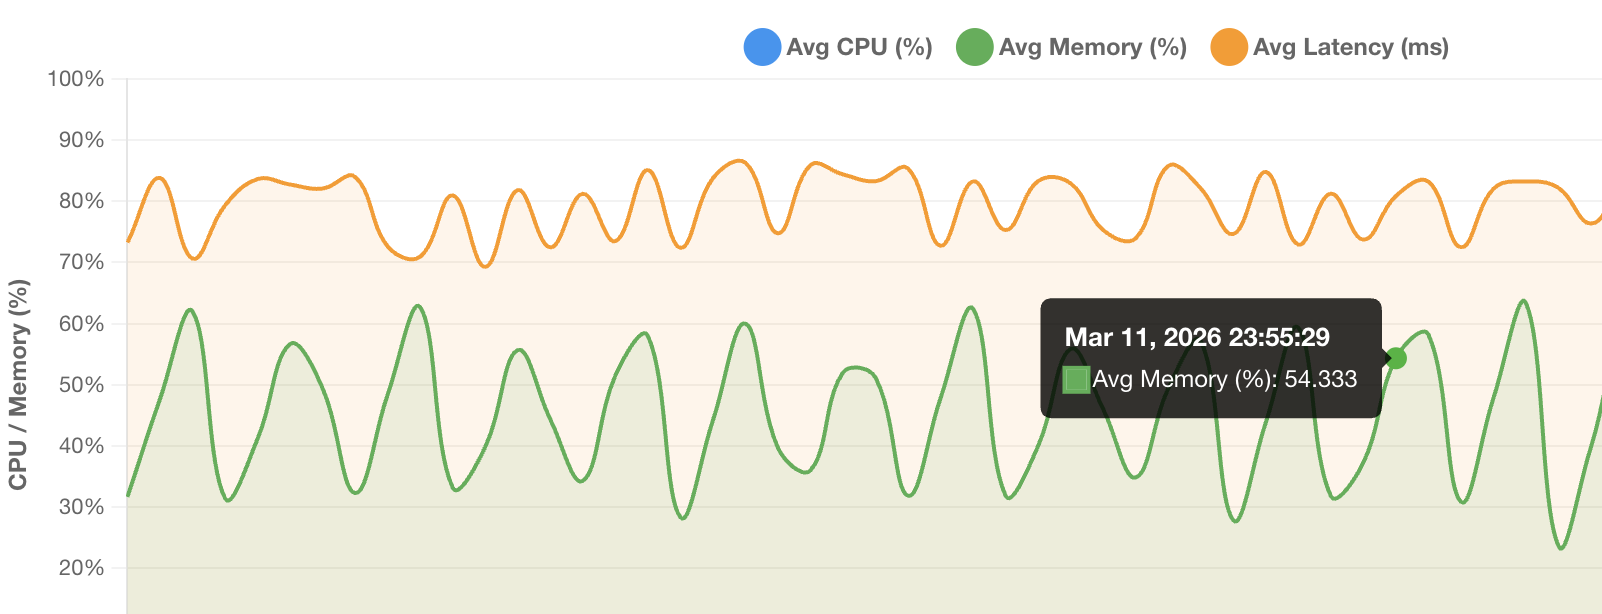
The histogram renders one page of data at a time — a subset of the full dataset within the selected time window. Use the pagination controls at the bottom of the dialog to move between pages and explore the complete dataset.

The pagination bar allows you to navigate to the first page, the previous page, the next page, or the last page.
2. Metric Visibility Toggles
Immediately below the histogram header, a Show metrics dropdown lets you control which metrics are rendered in the histogram, plus Select All and Clear All shortcuts for toggling every metric at once.

Opening the dropdown reveals a checkbox per metric:
| Checkbox | Metric | Axis |
|---|---|---|
| CPU | Average CPU usage | Left (%) |
| Memory | Average memory consumption | Left (%) |
| Latency | Average network latency | Right (ms) |
| Log Pressure | Average log buffer occupancy | Left (%) |
| Pressure | Average metrics-queue occupancy — see Pressure SLA | Left (%) |
| Queue Usage | One of the two factors Pressure averages — see Agent Details — Real-Time Performance Metrics | Left (%) |
| Heap Usage | The other factor Pressure averages | Left (%) |
Each metric is color-coded to match its corresponding line in the histogram and its entry in the legend above the chart — blue for CPU, green for memory, orange for latency, purple for log pressure, teal for pressure, indigo for queue usage, and crimson for heap usage. The dropdown's label summarizes the current selection ("All metrics", "3 metrics", etc.) so you don't need to reopen it to see what's currently shown.
Checking or unchecking a metric immediately shows or hides the corresponding dataset in the histogram without reloading data. This makes it easy to focus on a single metric when the chart is visually busy, or to compare two metrics in isolation by hiding the rest.
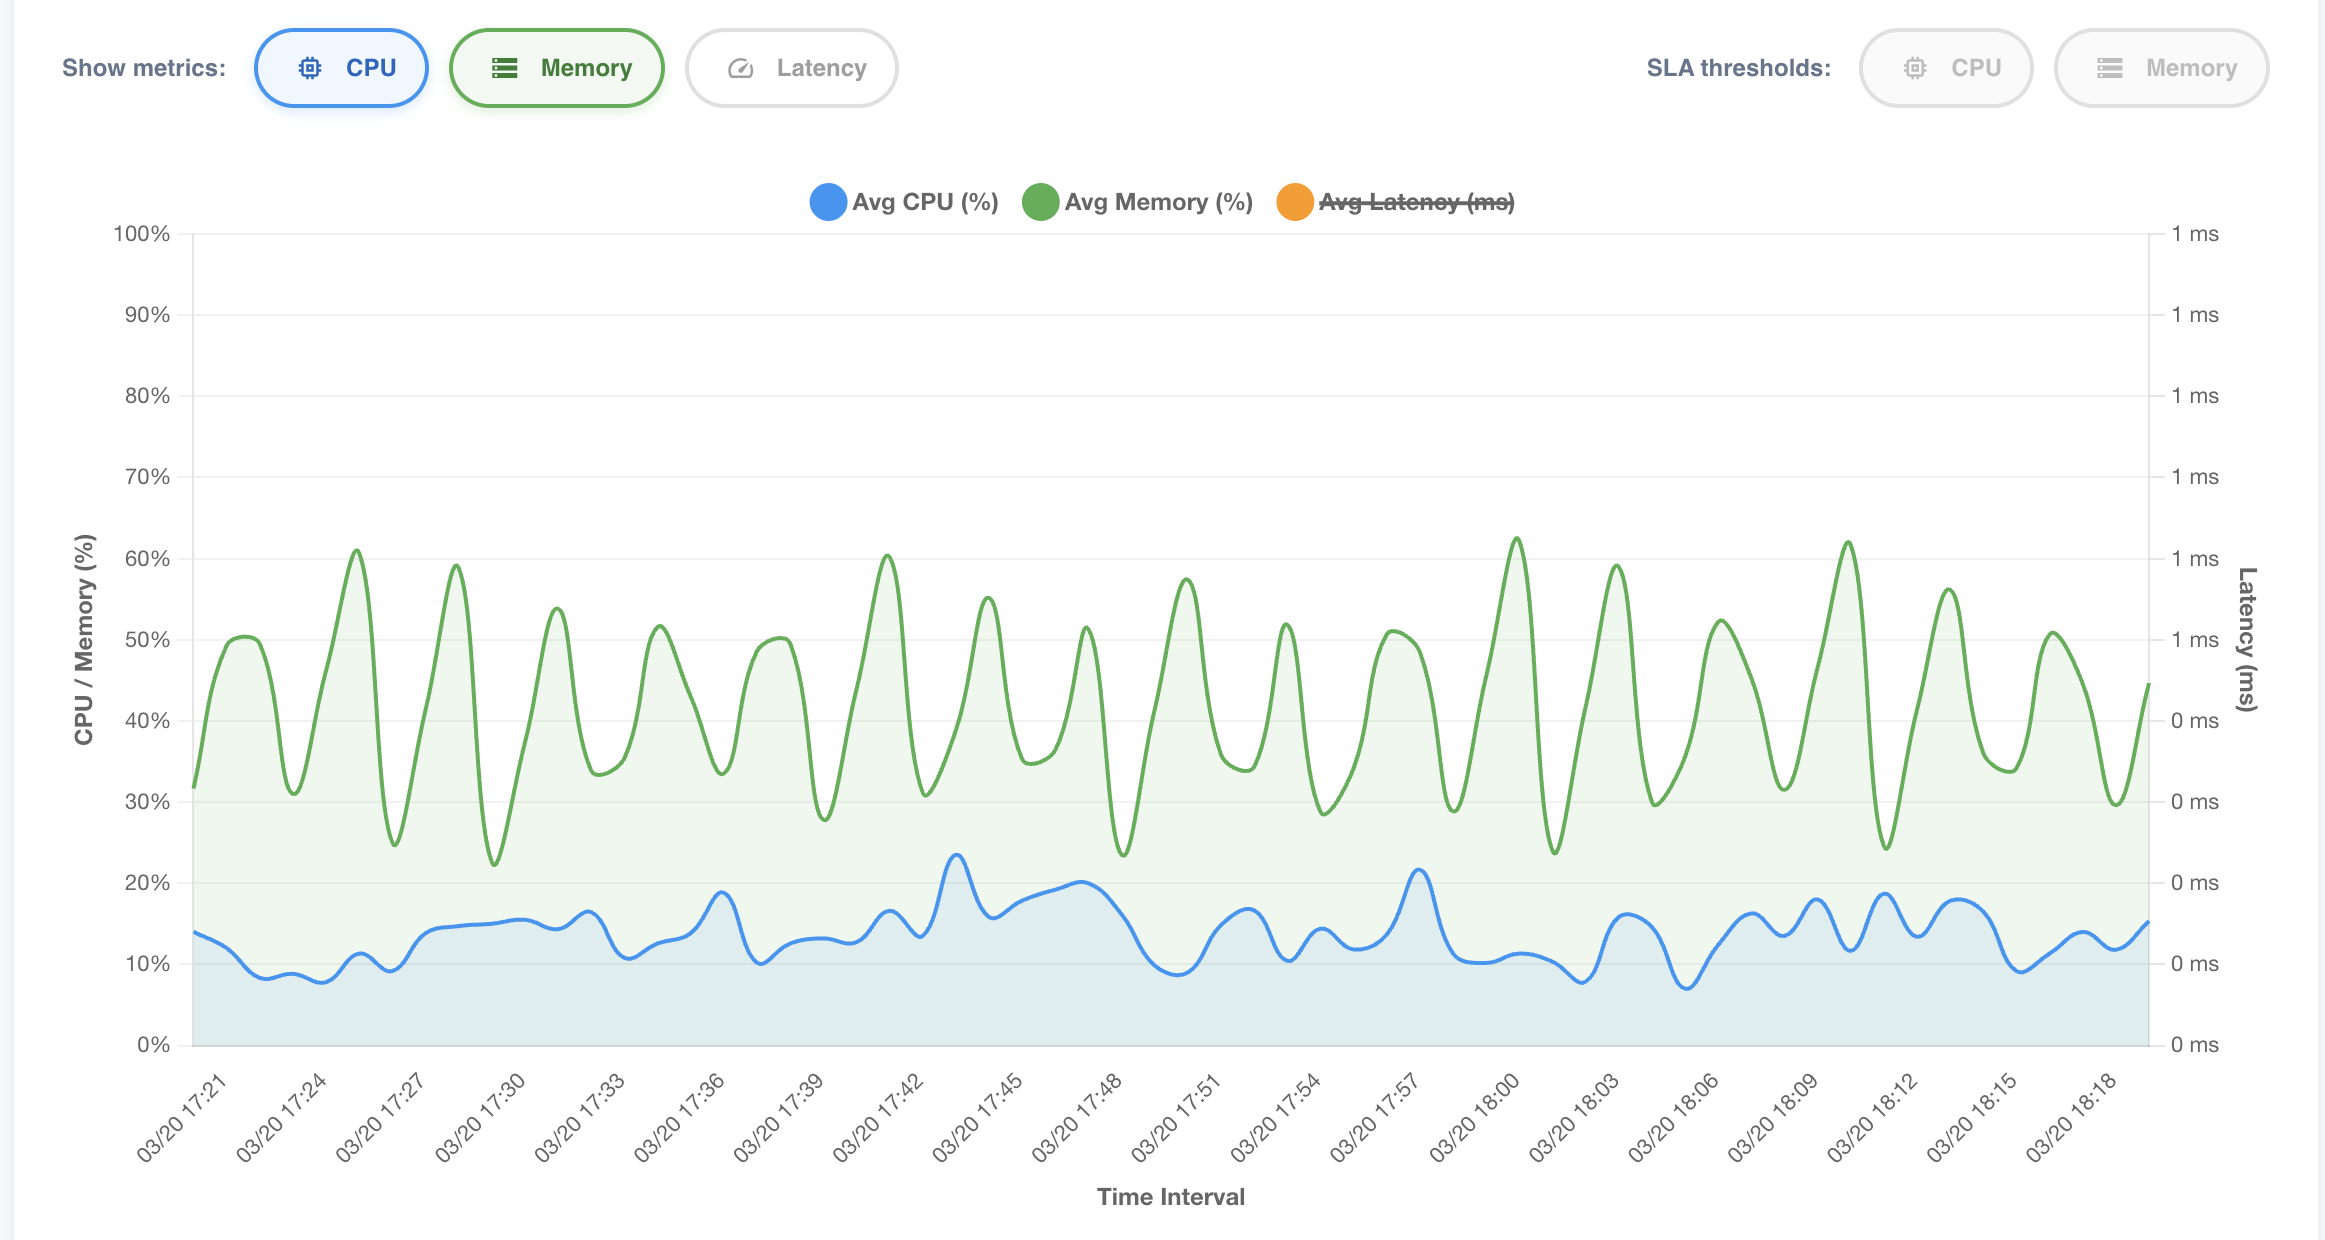
Comparing two metrics
If you want to compare CPU and memory independently of everything else, open the dropdown, click Clear All, then check just CPU and Memory. The histogram rescales automatically so the remaining datasets use the full available height.
3. SLA Threshold Overlays
To the right of the Show metrics dropdown, an SLA thresholds dropdown lets you overlay the configured SLA breach thresholds directly onto the histogram.

When a metric is checked here, its thresholds are rendered as two horizontal reference lines on the chart:
- SET threshold — a solid line indicating the level above which the SLA breach condition is triggered. Breaches are only raised after the metric remains above this value for the configured SET time window.
- RESET threshold — a dashed line indicating the level below which the breach is considered resolved. The breach is only cleared after the metric remains below this value for the configured RESET time window.
Both lines are color-coded to match the metric they belong to, making it straightforward to identify which threshold belongs to which dataset even when multiple overlays are active simultaneously. Each line is also labelled inline at the right edge of the chart area. The dropdown's label reflects the current selection — "No thresholds selected" when empty, as in the screenshot above.
Availability
A metric only appears as a checkbox in this dropdown if it has SLA monitoring explicitly enabled in the agent's configuration. If a metric's SLA monitoring is disabled, it's left out of the list entirely.
Additionally, a metric's threshold overlay only renders when its corresponding metric is also checked in the Show metrics dropdown. Hiding a metric from the histogram also hides its threshold overlay, even if it's still checked here.
Thresholds are for reference only
Enabling the threshold overlay does not affect how the histogram data is loaded or aggregated — it is a purely visual aid. The SET and RESET lines reflect the thresholds as currently configured in the agent's SLA settings, and update automatically if the configuration changes.
Diagnosing breach events
Enabling SLA threshold overlays is particularly useful when reviewing a time window where a monitoring alert was triggered. By overlaying the thresholds on top of the actual metric data, you can visually confirm when and for how long the metric exceeded the SET threshold, and how quickly it recovered below the RESET threshold.
4. Time Range
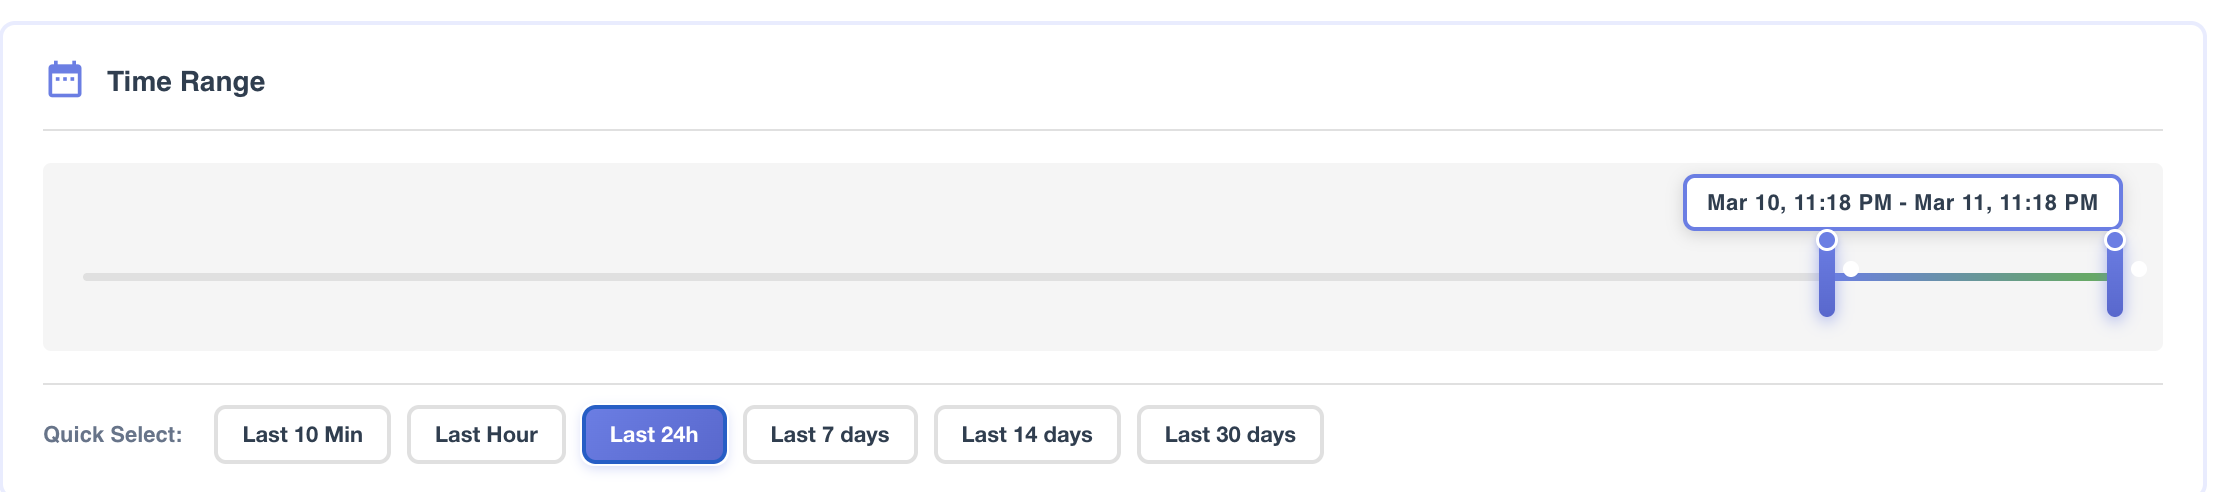
This section controls the time window rendered in the Metrics Timeline histogram.
Time Window Slider
A dual-handle range slider defines the start and end of the time window:
- Left handle — defines the beginning of the time window. Drag it left or right to adjust the start point.
- Right handle — defines the end of the time window. The end point must always be greater than the start point.
Together, the two handles let you select any sub-interval within the available data range.
Data retention limit
The time window cannot extend beyond one month into the past from the current moment. This is BizMetry's preconfigured statistics archival window, designed to prevent unbounded storage growth. Any data older than this threshold is automatically archived and considered cold data, and is not accessible from this view.
Quick Select Buttons
For convenience, a set of preset buttons allows you to set the time window instantly:
| Button | Time window |
|---|---|
| Last 10 min | Last 10 minutes |
| Last Hour | Last 60 minutes |
| Last 24 Hours | Last 24 hours |
| Last 7 Days | Last 7 days |
| Last 14 Days | Last 14 days |
| Last 30 Days | Last 30 days (maximum) |
Selecting a preset automatically adjusts which aggregation interval options are available in the next section.
5. Aggregation Interval
This section controls how metrics are grouped and averaged before being rendered in the histogram.

A lower aggregation interval produces more granular, precise metrics at the cost of higher computational load. A higher interval produces smoother, less detailed metrics but is faster to compute and renders more quickly.
Aggregation Slider
A continuous slider lets you set the aggregation interval anywhere from 10 seconds (minimum) to 60 minutes (maximum). When the value changes, the histogram is recalculated and the time axis updates to reflect the new interval.
Aggregation Presets
Quick-select buttons are available for common intervals:
| Preset | Interval |
|---|---|
| 10s | 10 seconds (minimum granularity) |
| 1m | 1 minute |
| 5m | 5 minutes |
| 15m | 15 minutes |
| 30m | 30 minutes |
| 1h | 1 hour |
| 1d | 1 day |
Not all presets are available at all times — BizMetry automatically enables or disables them based on the selected time range, to prevent performance degradation when querying large datasets:
| Time Range | Available Aggregation Intervals |
|---|---|
| Last 10 minutes | 10s, 1m, 5m |
| Last Hour | 10s, 1m, 5m, 15m, 30m |
| Last 24 Hours | 1m, 5m, 15m, 30m, 1h |
| Last 7, 14, or 30 Days | 1m, 5m, 15m, 30m, 1h, 1d |
6. Metrics Resolution
This section controls the number of data points displayed per histogram page.

Available resolutions are: 15, 30, 45, 60, and 90 data points per page.
A higher resolution shows more data points per page, making it easier to identify patterns and trends across a dense dataset. A lower resolution is better suited for focused analysis of a specific section of the sample, where a cleaner, less crowded view is preferable.
7. Pagination Controls
The pagination bar at the bottom of the dialog allows you to navigate between pages of the histogram dataset.
The available controls are:
- First page — jump to the beginning of the dataset.
- Previous page — move one page back.
- Next page — move one page forward.
- Last page — jump to the most recent page of the dataset.
Live Monitoring Mode
At any point, you can switch to Live Monitoring mode by enabling the toggle at the top of the dialog.

When Live Monitoring is active:
- A visual indication appears with the label "Live Monitoring" and the time sync interval for reference
- The histogram updates automatically with each agent synchronization cycle, reflecting the agent's current state in real time.
- All configuration controls (time range, aggregation interval, resolution, pagination) are disabled — the view is fully driven by incoming sync data.
- The aggregation interval is automatically set to match the agent's synchronization interval.
This mode is particularly useful when investigating an ongoing issue, performing a deployment, or validating that an agent is healthy immediately after a configuration change.
To exit Live Monitoring mode, slide the toggle back to the left. All controls are re-enabled and the histogram returns to its last manually configured state.
Live Monitoring and sync frequency
The refresh rate in Live Monitoring mode is determined by the agent's configured synchronization interval. If the agent syncs every 30 seconds, the histogram will update every 30 seconds. For higher-frequency monitoring, consider reducing the agent's sync interval in its configuration.