SLA Configuration
BizMetry includes a continuous agent monitoring system that tracks key infrastructure metrics of each agent in real time. When a metric exceeds a defined threshold for a sustained period, BizMetry triggers an SLA breach alert, making it immediately visible across the platform so operators can take action before the agent degrades or goes offline.
SLA monitoring can be independently enabled or disabled per metric, giving you fine-grained control over which conditions are actively watched.
To access this configuration, open the Agent Configuration dialog and select the SLAs tab.
How SLA Monitoring Works — Hysteresis
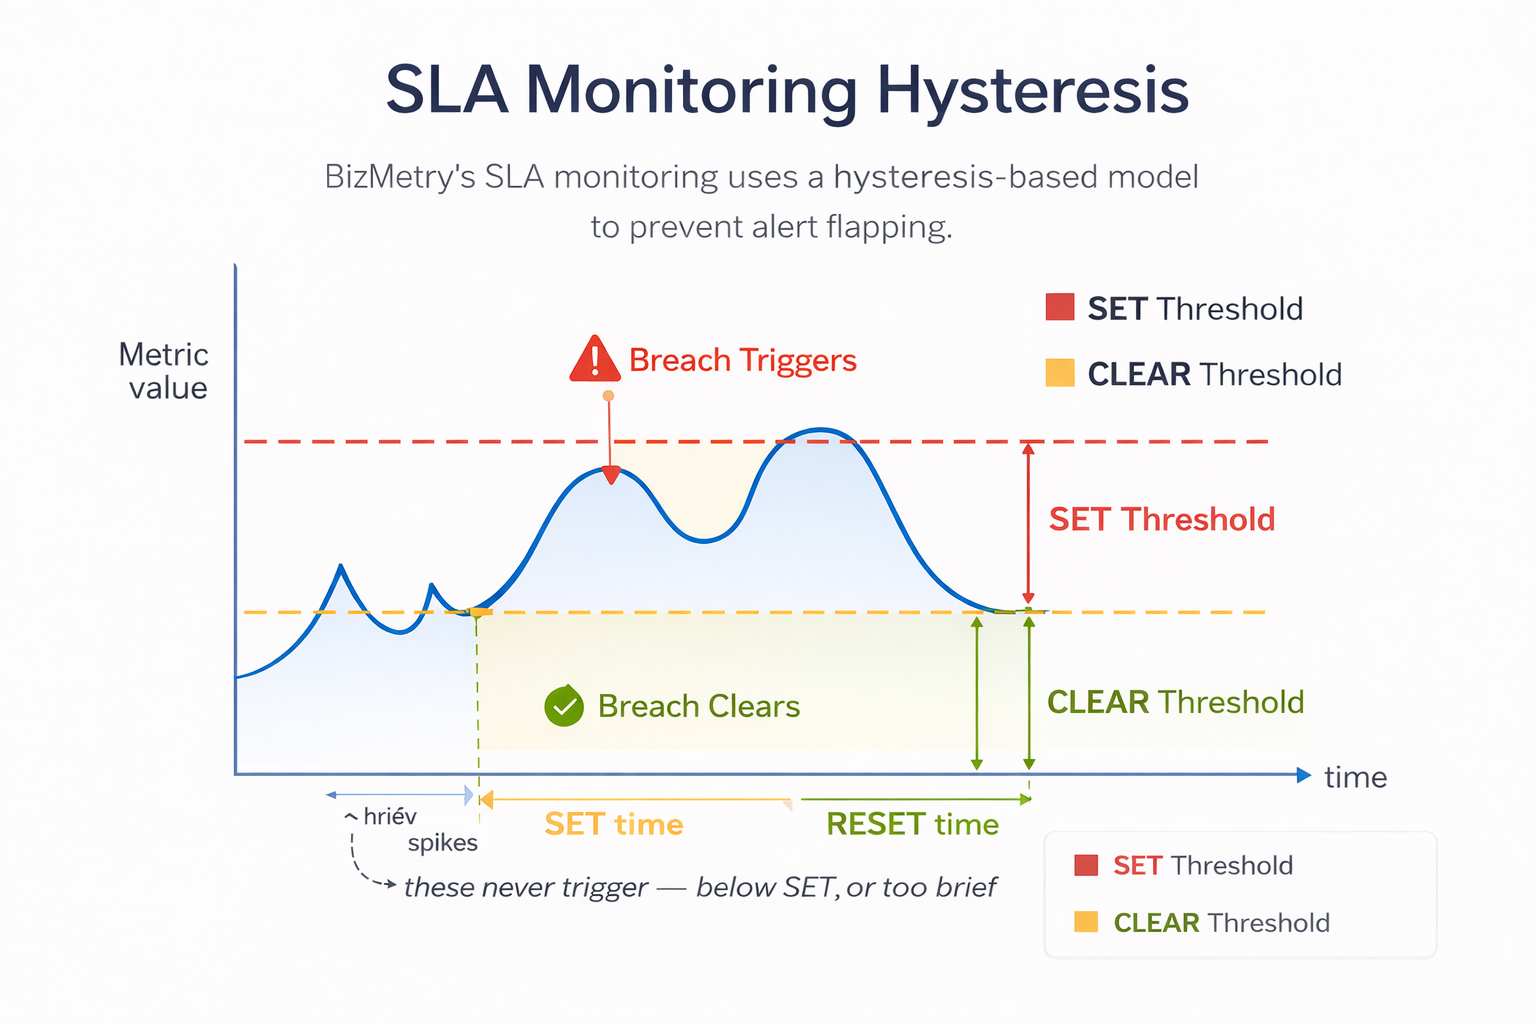
BizMetry's SLA monitoring uses a hysteresis-based model to determine when to trigger and when to clear a breach alert. This approach prevents alert flapping — a situation where an alert is repeatedly triggered and cleared in quick succession due to a metric oscillating around a threshold.
Rather than using a single threshold value, each metric is configured with two separate thresholds and two time windows:
- SET threshold (upper) — the value above which the metric is considered elevated.
- CLEAR threshold (lower) — the value below which the metric is considered recovered.
- SET time — the number of consecutive minutes the metric must remain above the SET threshold before the breach is triggered.
- RESET time — the number of consecutive minutes the metric must remain below the CLEAR threshold before the breach is cleared.
This creates a deliberate gap between the trigger and recovery conditions. A metric must sustain an elevated state for the full SET time window before an alert fires, and must sustain a recovered state for the full RESET time window before the alert clears. Transient spikes that resolve quickly never trigger an alert, and brief dips below the CLEAR threshold do not prematurely clear an active breach.
The diagram below illustrates this behavior:
Monitoring and Alert Toggles
Each metric section has two independent toggles that control how BizMetry reacts when a threshold is breached:

| Toggle | Description |
|---|---|
| SLA Monitoring Enabled | Activates continuous tracking of the metric against the configured thresholds. When enabled, BizMetry evaluates the metric in real time and detects breach conditions. When disabled, the metric is not evaluated and no breach state is ever entered — regardless of the alert toggle. |
| Alerts Generation | Controls whether a detected breach generates a notification entry. When enabled, every breach trigger and clearance creates a record in BizMetry's notification system. When disabled, breaches are still detected and surfaced visually (agent card pulsing, Agent Panel indicator), but no notification is written. |
These two toggles are independent. This allows the following combinations:
| Monitoring | Alerts | Behavior |
|---|---|---|
| ON | ON | Full SLA monitoring — breaches are detected, shown visually, and generate notifications. |
| ON | OFF | Silent monitoring — breaches are detected and shown visually, but no notifications are generated. Useful when visual indicators are sufficient and notification noise should be minimized. |
| OFF | any | Monitoring is inactive — no breach detection, no visual indicators, no notifications. |
Alerts Generation requires Monitoring to be active
Enabling Alerts Generation while SLA Monitoring is disabled has no effect. Notifications are only generated when a breach is actually detected, which requires monitoring to be ON.
CPU Usage
The CPU tab monitors the average CPU consumption of the agent process. High or sustained CPU usage may indicate that the agent is under heavy load, misconfigured, or experiencing resource contention with other workloads on the same host.
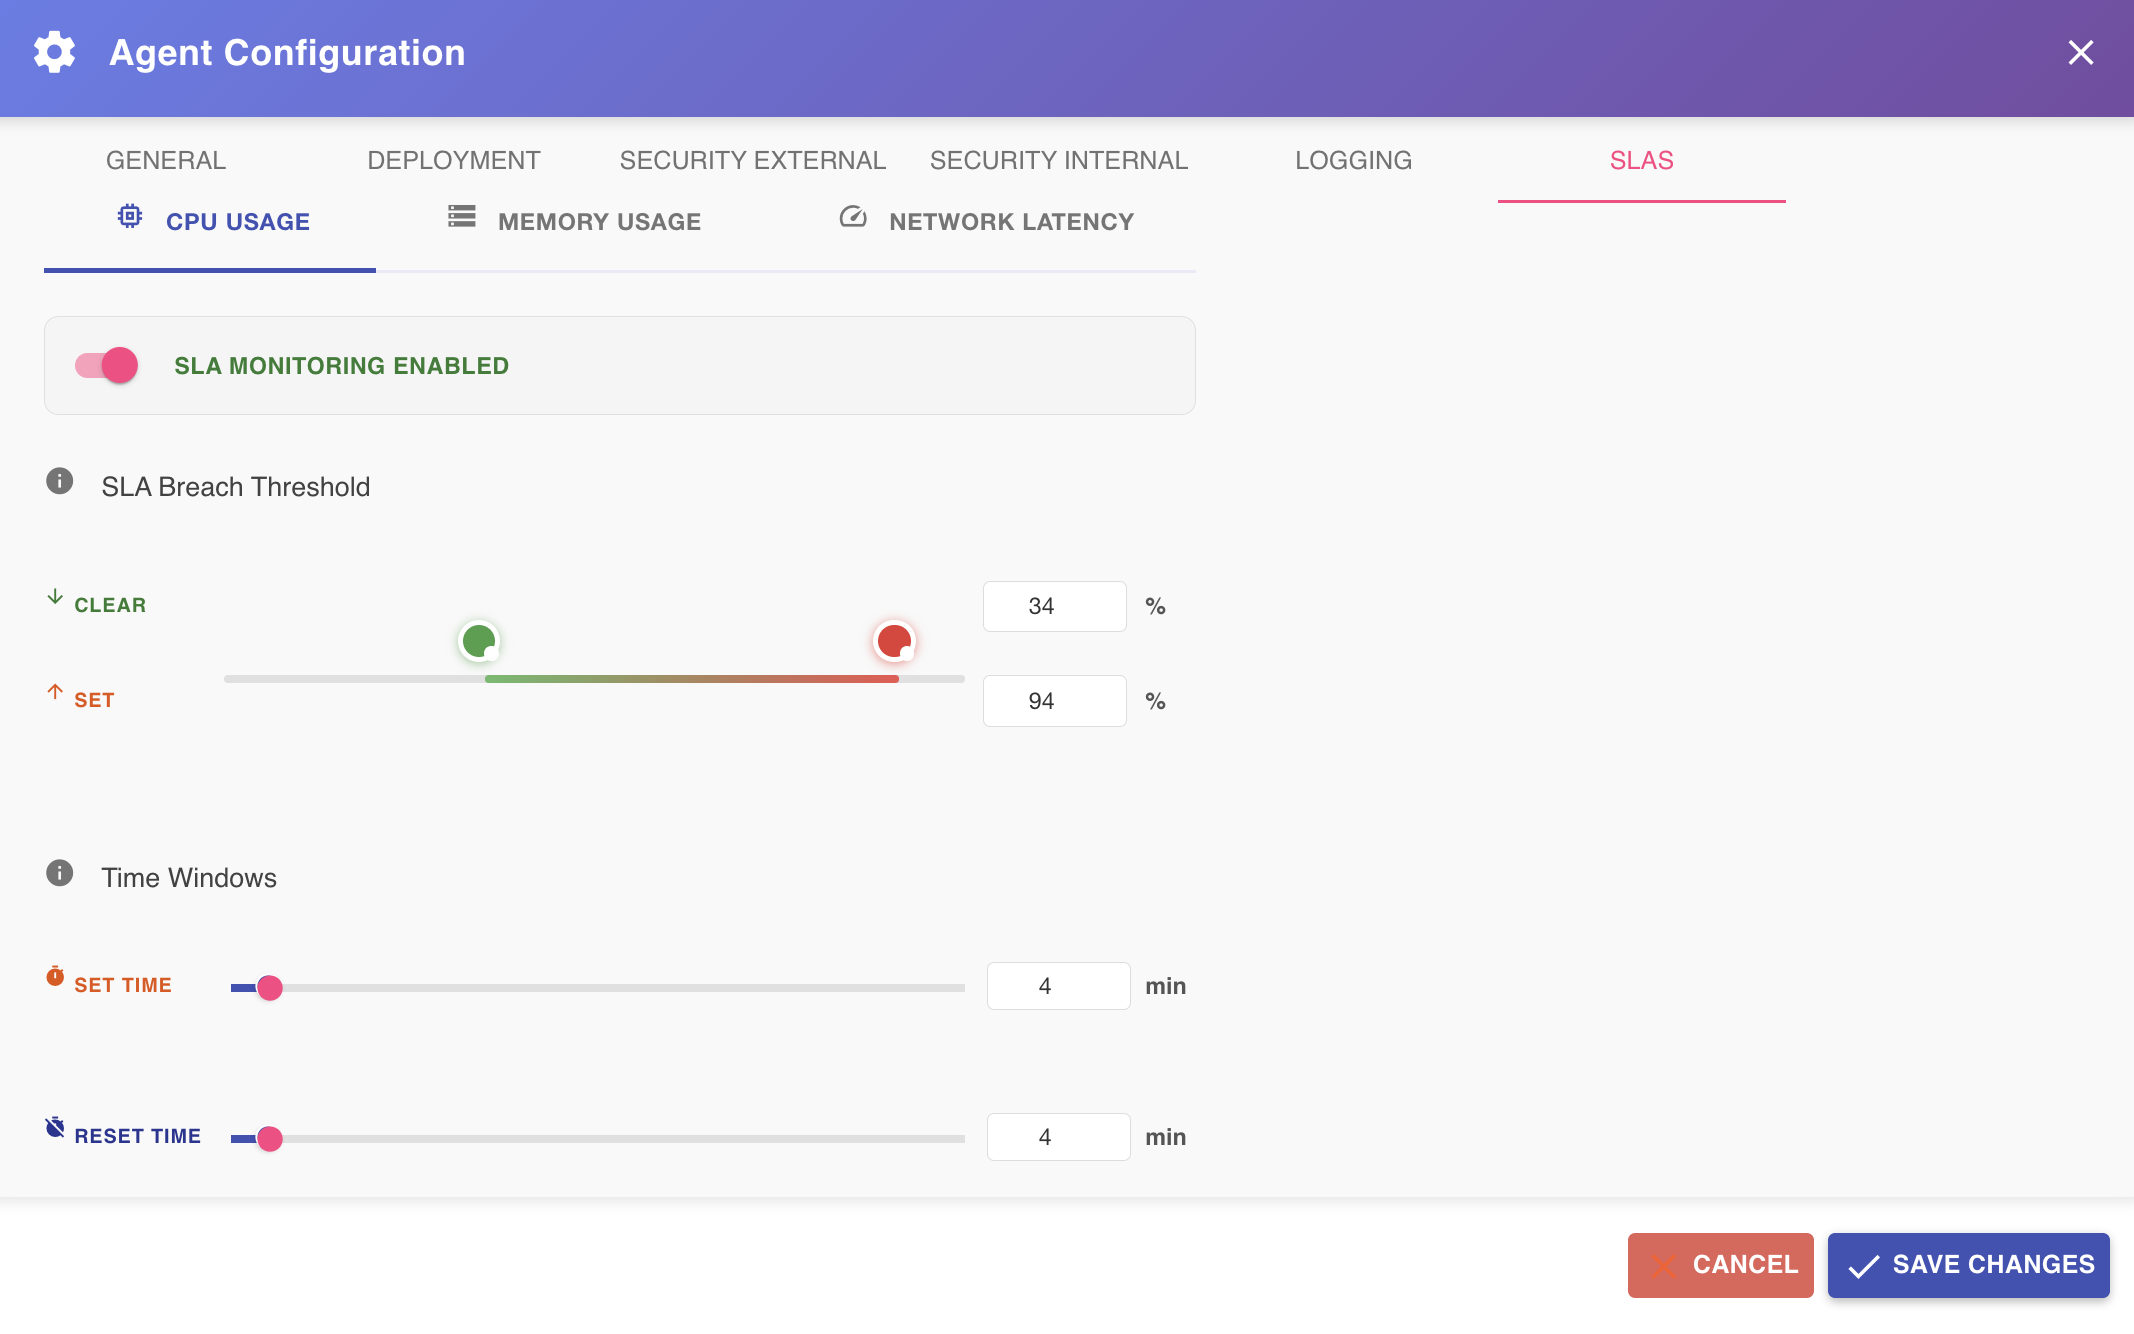
Use the Monitoring and Alert Toggles to activate CPU monitoring and configure notification behavior.
SLA Breach Threshold
The dual-handle slider defines the two threshold values used by the hysteresis model:
- SET threshold (upper handle, shown in red) — the maximum average CPU usage percentage that, if exceeded for the configured SET time window, triggers the breach alert.
- CLEAR threshold (lower handle, shown in green) — the CPU usage percentage below which, if sustained for the configured RESET time window, the breach alert is cleared.
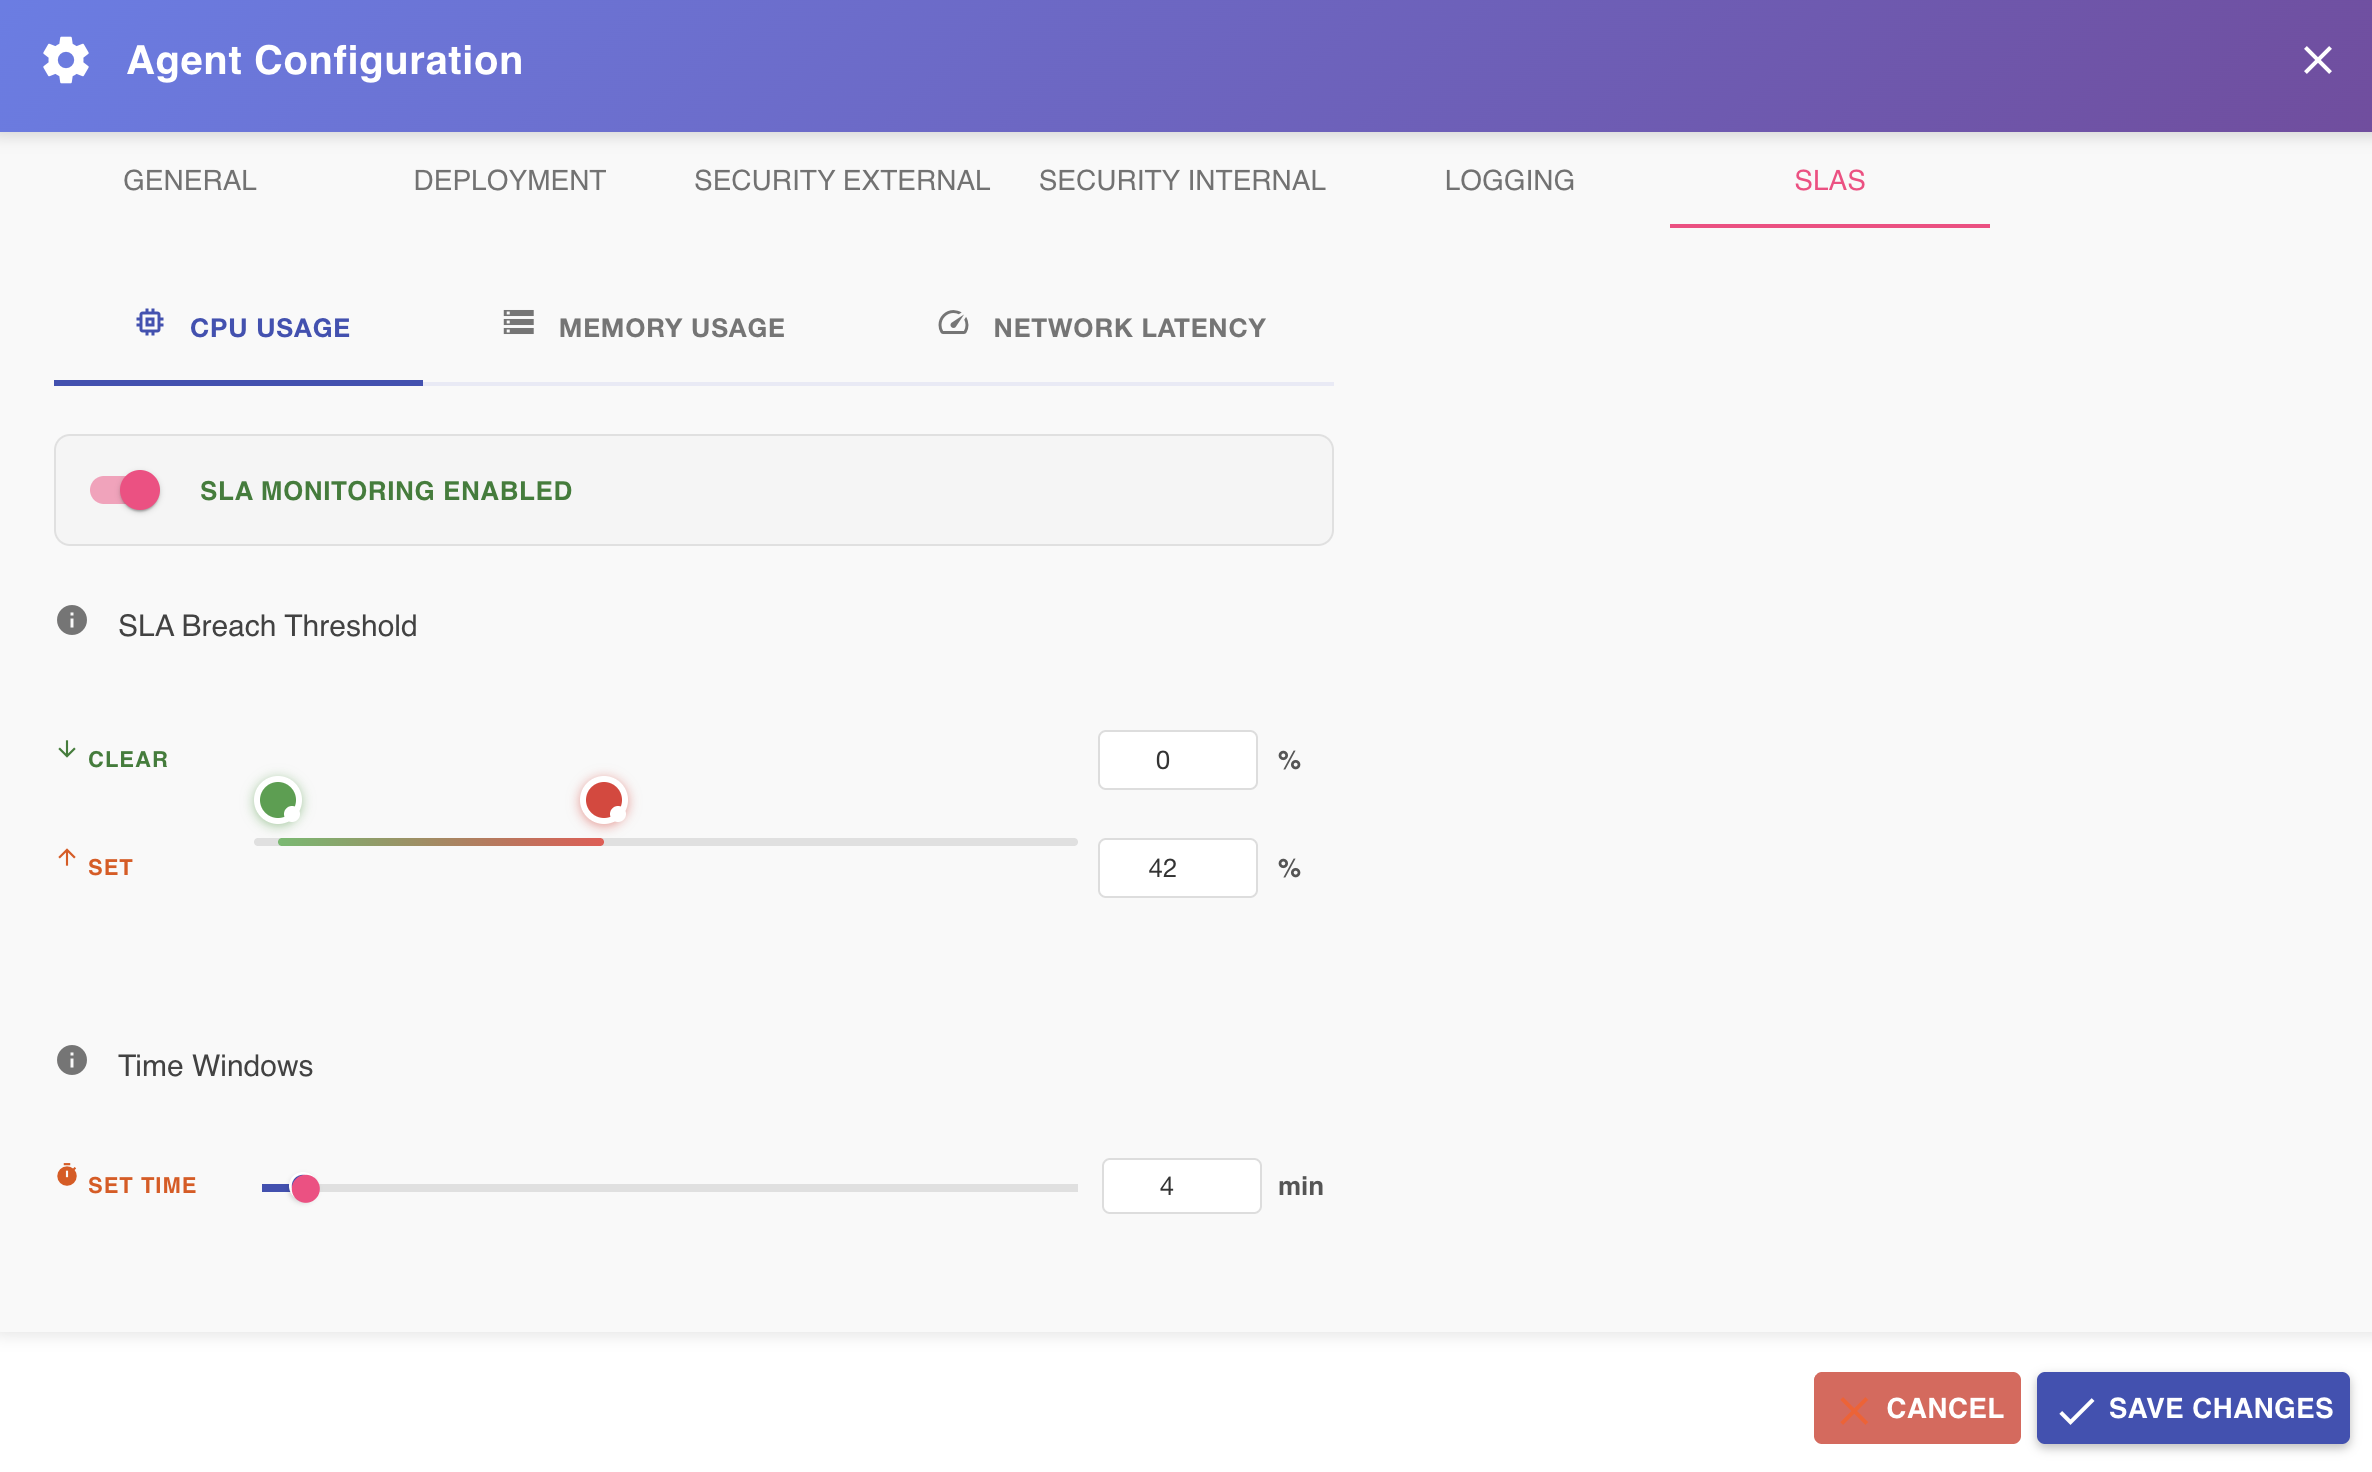
Drag each handle independently to set the desired values. The current threshold values are always shown to the right of the slider.
Time Windows
Defines the observation windows used by BizMetry to evaluate the CPU condition:
| Window | Description |
|---|---|
| Set Time (min) | Number of consecutive minutes CPU average must remain above the SET threshold before the breach alert is triggered. |
| Reset Time (min) | Number of consecutive minutes CPU average must remain below the CLEAR threshold before the breach alert is cleared. |
Recommendations: - A Set Time of 3–5 minutes avoids false positives from transient CPU spikes during normal workload bursts. - A Reset Time of 3–5 minutes prevents premature alert clearance if CPU briefly dips during an ongoing overload condition. - For production agents, consider a SET threshold of 80–90% and a CLEAR threshold of 60–70%, leaving a meaningful gap between the two.
Memory Usage
The Memory tab monitors the average memory consumption of the agent process. Sustained high memory usage may indicate a memory leak, oversized metric buffers, or inadequate Pod resource limits in the Kubernetes deployment.
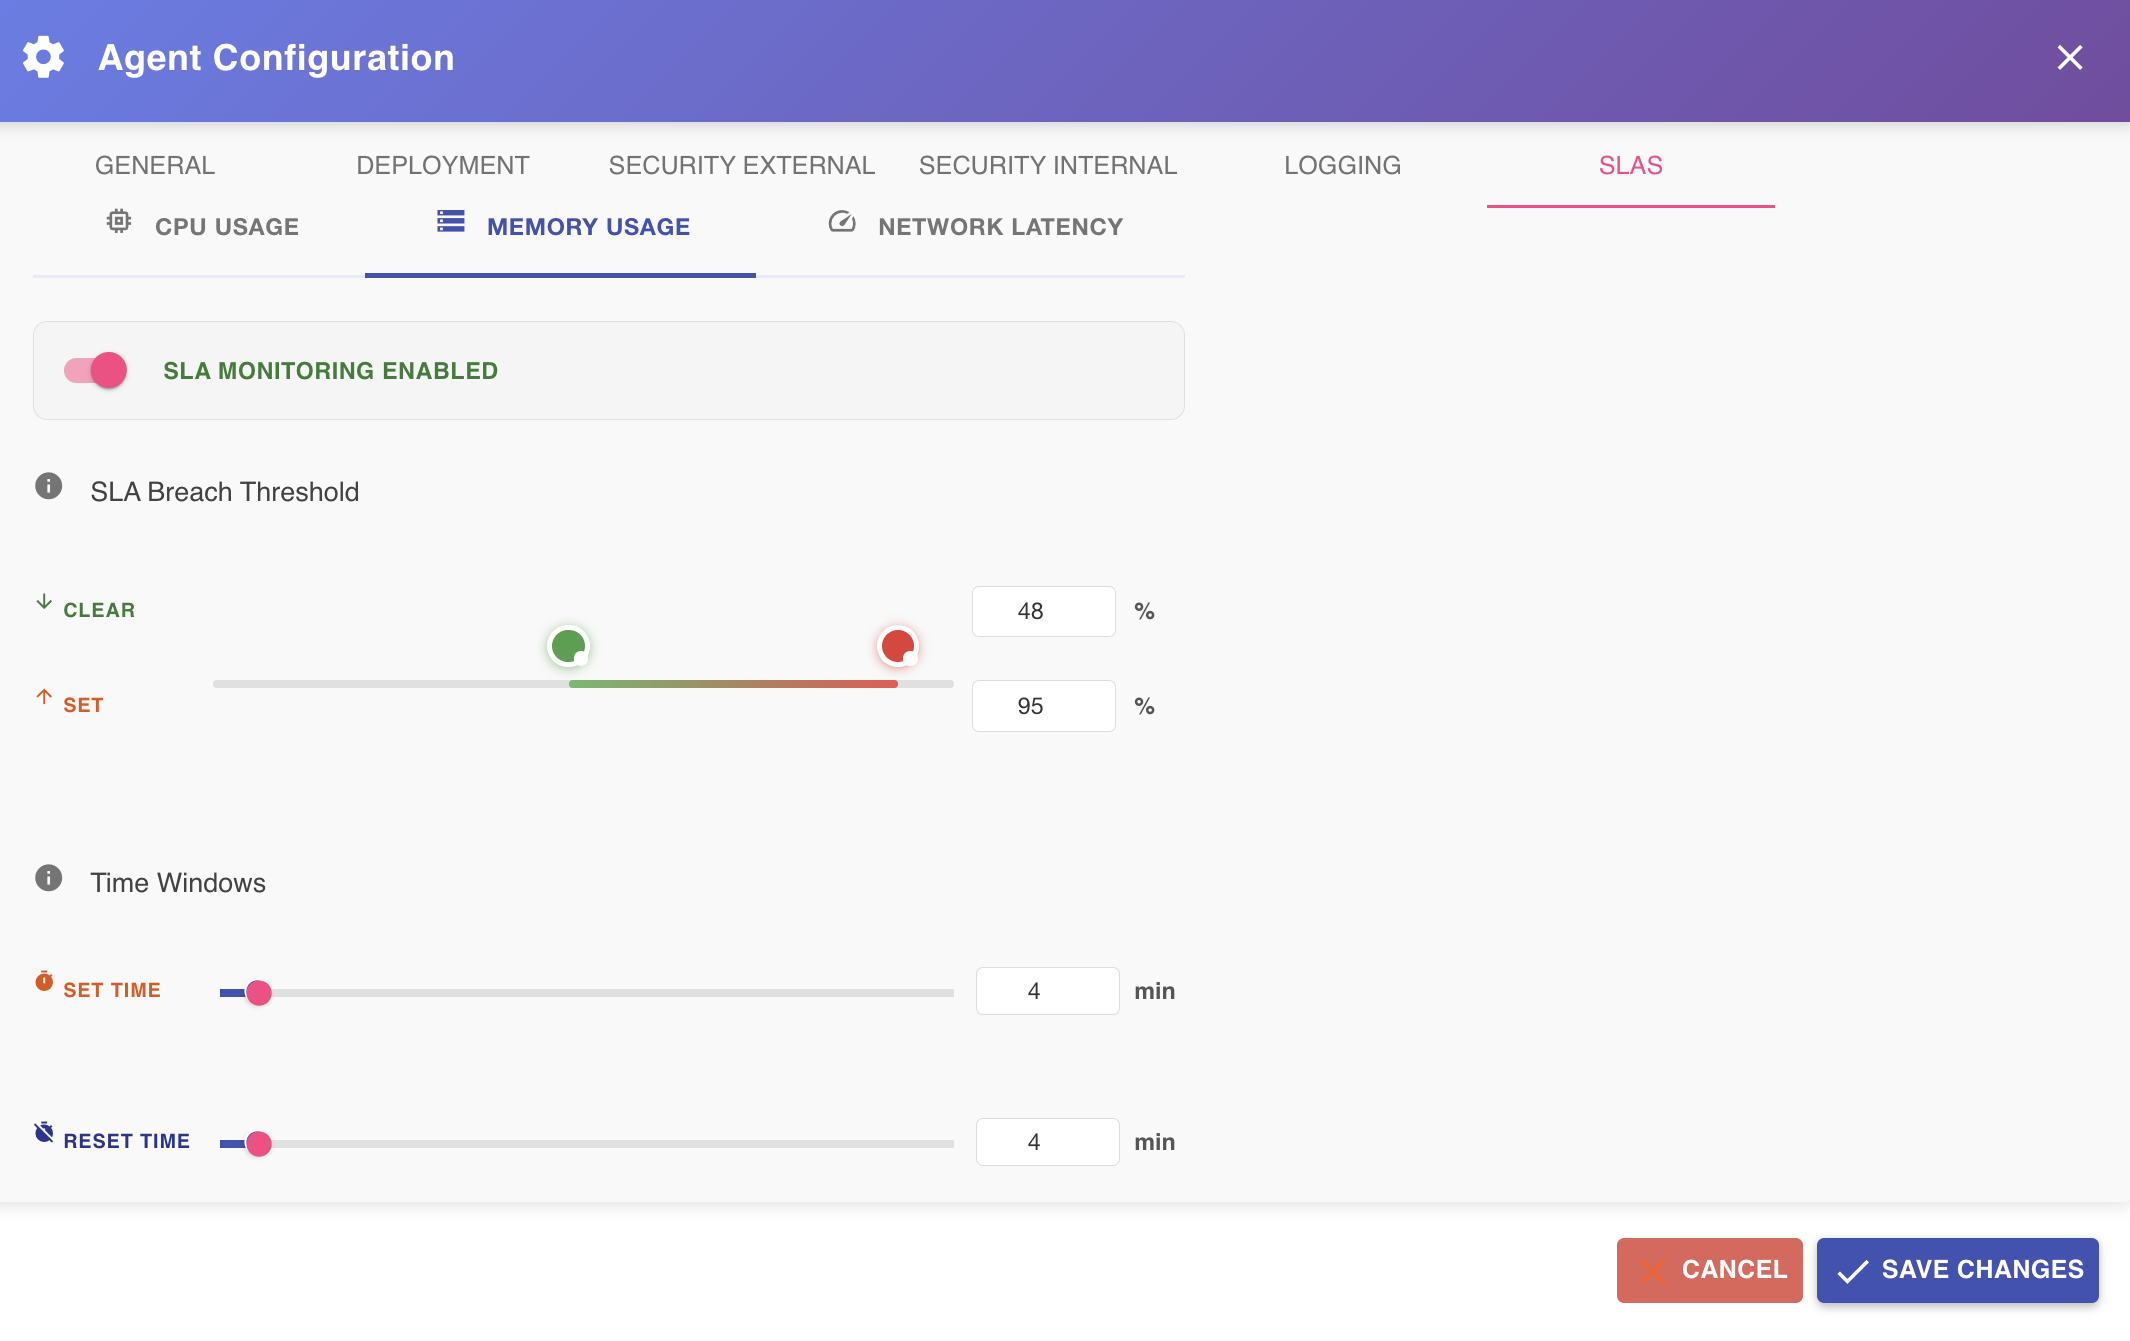
Use the Monitoring and Alert Toggles to activate memory monitoring and configure notification behavior.
SLA Breach Threshold
The dual-handle slider defines the two threshold values:
- SET threshold (upper handle, shown in red) — the maximum average memory usage percentage that, if exceeded for the configured SET time window, triggers the breach alert.
- CLEAR threshold (lower handle, shown in green) — the memory usage percentage below which, if sustained for the configured RESET time window, the breach alert is cleared.
Drag each handle independently to set the desired values. The current threshold values are always shown to the right of the slider.
Time Windows
| Window | Description |
|---|---|
| Set Time (min) | Number of consecutive minutes memory average must remain above the SET threshold before the breach alert is triggered. |
| Reset Time (min) | Number of consecutive minutes memory average must remain below the CLEAR threshold before the breach alert is cleared. |
Recommendations: - Memory usage tends to grow gradually rather than spike abruptly. A Set Time of 5–10 minutes is appropriate for most deployments. - If the agent is configured with large metric or log buffers (see Capacity Configuration and Logging Configuration), expect baseline memory usage to be higher — adjust thresholds accordingly to avoid false positives. - A CLEAR threshold significantly lower than the SET threshold (e.g., SET at 85%, CLEAR at 60%) gives the agent room to recover without prematurely clearing the alert during garbage collection cycles.
Network Latency
The Network Latency tab monitors the average round-trip latency between the agent and the BizMetry platform. Elevated latency may indicate network congestion, routing issues, or degraded connectivity between the agent's host and the platform.
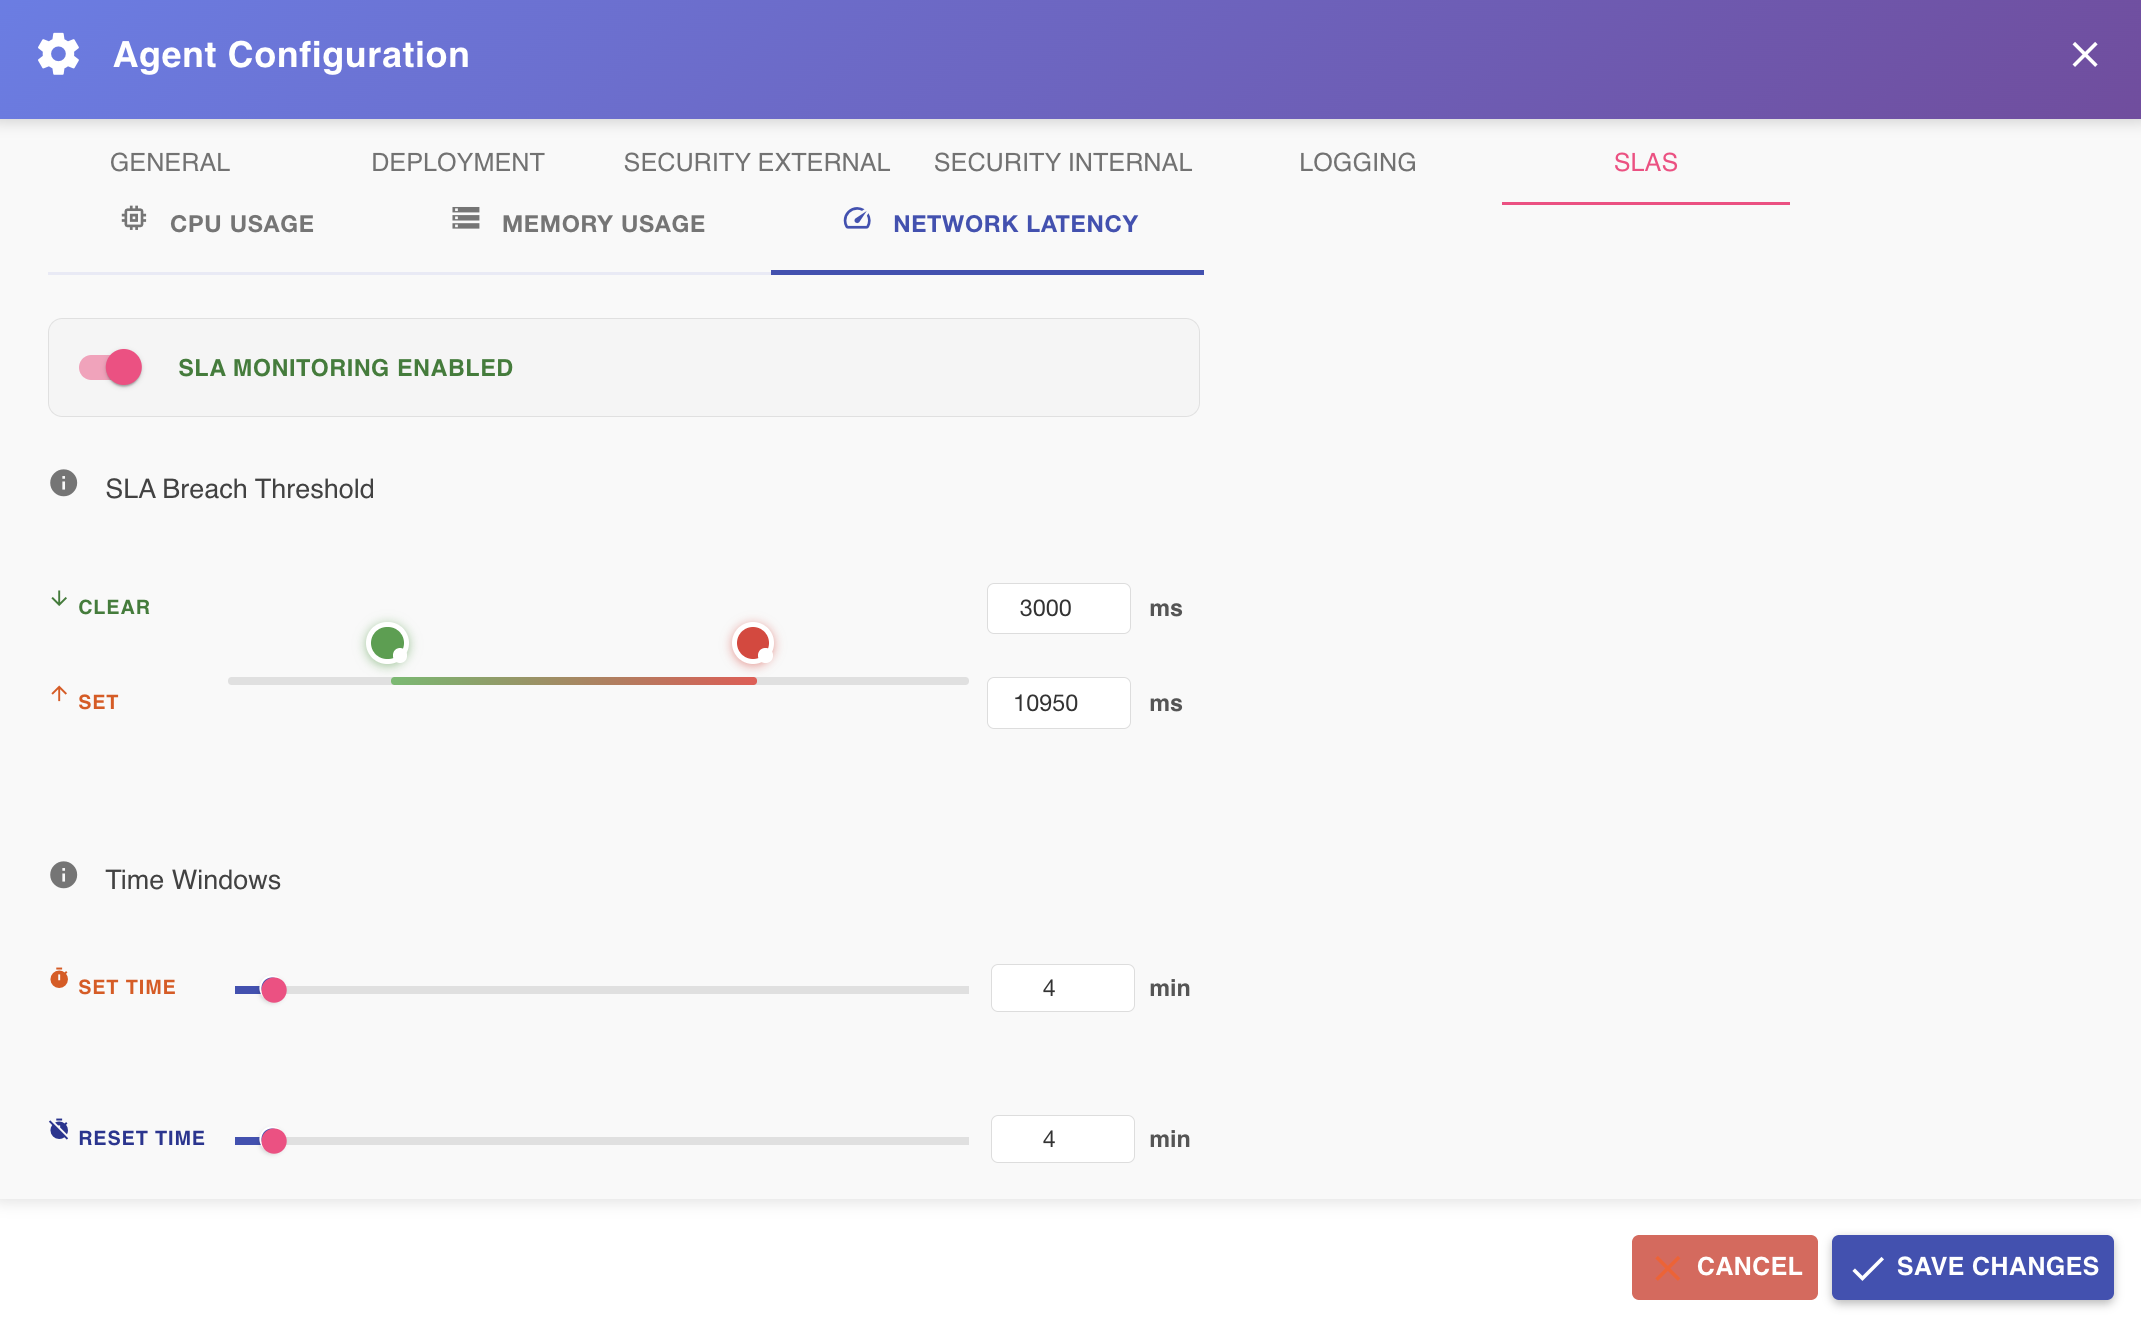
Use the Monitoring and Alert Toggles to activate latency monitoring and configure notification behavior.
SLA Breach Threshold
The dual-handle slider defines the two threshold values, expressed in milliseconds (maximum 15,000 ms):
- SET threshold (upper handle, shown in red) — the maximum average latency in milliseconds that, if exceeded for the configured SET time window, triggers the breach alert.
- CLEAR threshold (lower handle, shown in green) — the latency in milliseconds below which, if sustained for the configured RESET time window, the breach alert is cleared.
Drag each handle independently to set the desired values. The current threshold values are always shown to the right of the slider.
Time Windows
| Window | Description |
|---|---|
| Set Time (min) | Number of consecutive minutes average latency must remain above the SET threshold before the breach alert is triggered. |
| Reset Time (min) | Number of consecutive minutes average latency must remain below the CLEAR threshold before the breach alert is cleared. |
Recommendations: - Acceptable latency thresholds depend heavily on the network environment. For cloud deployments, SET thresholds of 500–1000 ms are typical. For on-premises deployments on a fast LAN, even 200–300 ms may indicate a problem. - Network latency can fluctuate briefly due to transient congestion. A Set Time of 3–5 minutes filters out short-lived spikes without masking genuine degradation.
Pressure
The Pressure tab monitors the agent's own queue occupancy — how full its metrics-delivery capacity currently is, as a percentage (see Capacity Configuration). Sustained high pressure means the agent is receiving frames faster than it can drain them downstream, and is the same signal that governs whether the agent accepts or rejects incoming upload batches — see Real-Time Performance Metrics for how Load Pressure is surfaced elsewhere in the Agent Details dialog.
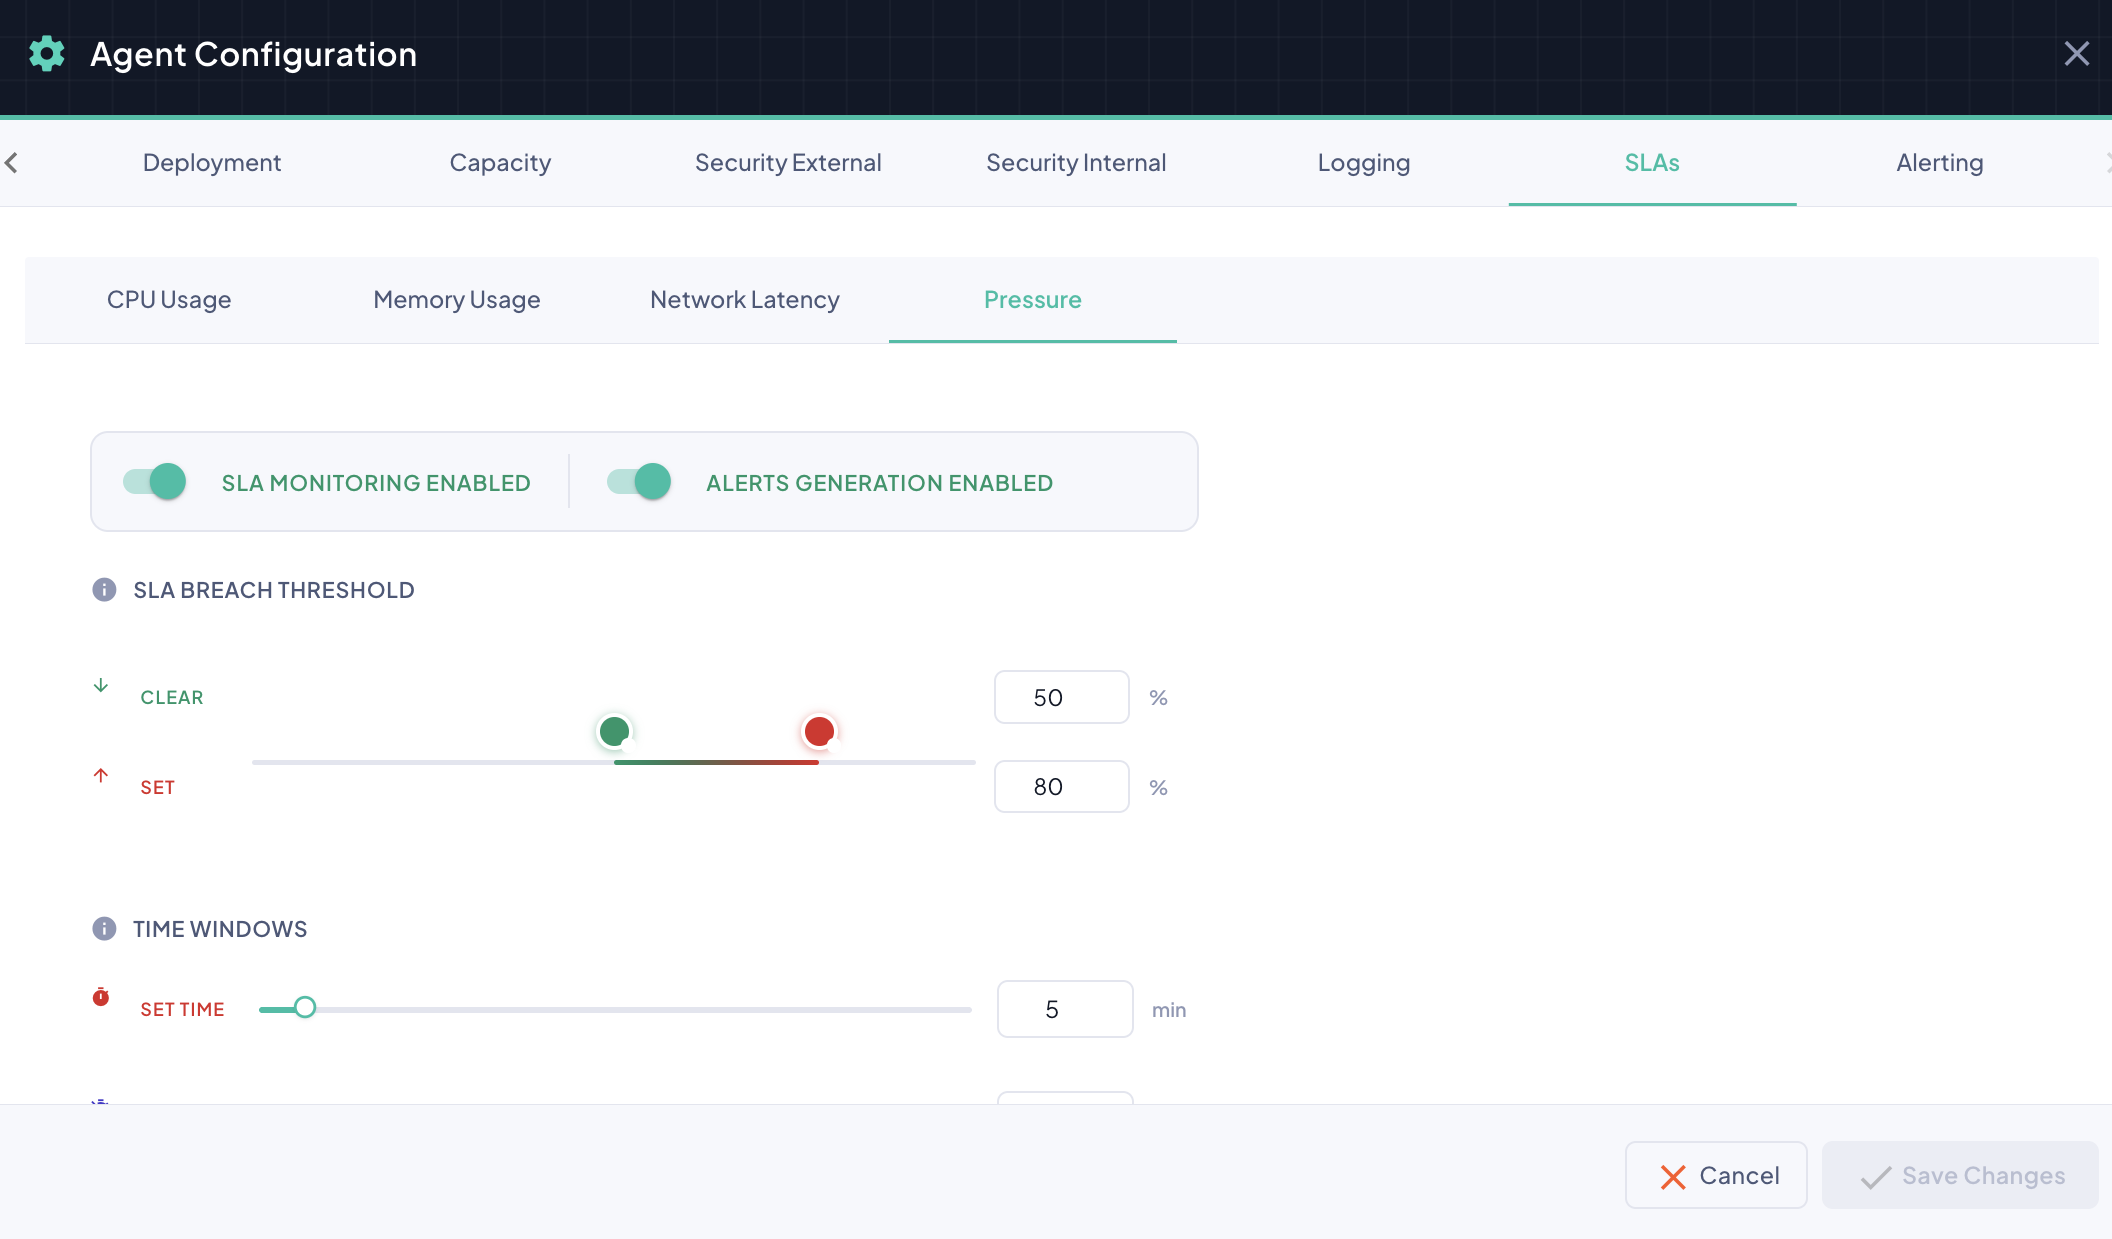
Use the Monitoring and Alert Toggles to activate pressure monitoring and configure notification behavior.
SLA Breach Threshold
The dual-handle slider defines the two threshold values, as a percentage of queue capacity:
- SET threshold (upper handle, shown in red) — the queue occupancy percentage that, if exceeded for the configured SET time window, triggers the breach alert.
- CLEAR threshold (lower handle, shown in green) — the queue occupancy percentage below which, if sustained for the configured RESET time window, the breach alert is cleared.
Drag each handle independently to set the desired values. The current threshold values are always shown to the right of the slider.
Time Windows
| Window | Description |
|---|---|
| Set Time (min) | Number of consecutive minutes average pressure must remain above the SET threshold before the breach alert is triggered. |
| Reset Time (min) | Number of consecutive minutes average pressure must remain below the CLEAR threshold before the breach alert is cleared. |
A queue that stays near 100% starts rejecting whole batches
Unlike CPU or Memory, Pressure isn't just a resource-usage indicator — once the queue is full, the agent rejects entire incoming upload batches outright rather than accepting them and applying backpressure gracefully. Interceptors uploading to this agent see this as an Upload Failing condition on their end (see the interceptor's own Pressure Alert and Upload Failing alerts), and their local Backpressure Auto-Tuner deliberately stops growing its own worker count while this agent-side condition persists, since adding more upload attempts against a full queue only wastes work.
Recommendations: - A SET threshold of 80–90% gives you advance warning before the queue actually starts rejecting batches. - A CLEAR threshold meaningfully lower than SET (e.g. SET at 80%, CLEAR at 50%) avoids the alert flapping while the queue drains gradually rather than all at once. - If Pressure regularly sits high under normal load, consider raising Metrics Frame Buffer Capacity, the agent's SAF Forwarder Max Count, or its Number of Replicas rather than just loosening the threshold.
SLA Breach Alerts
When a breach condition is confirmed — after the metric has been above the SET threshold for the full SET time window — BizMetry triggers an SLA breach alert that is surfaced in two places across the platform:
On the Agent Card The agent card in the Agents tab of the Profile view displays a visual breach indicator. The card enters a pulsing fade-in/fade-out animation to draw immediate attention to the affected agent.
Do not ignore a pulsing agent card
The pulsing animation is BizMetry's strongest visual signal that an agent requires immediate attention. A sustained breach may indicate that the agent is approaching the limits of its operational capacity and could degrade or go offline if left unaddressed. Investigate and take corrective action as soon as possible.
On the Agent Panel The agent's row in the global Agents Panel also reflects the active breach, allowing operators monitoring the platform-wide view to detect affected agents without navigating to individual profiles.
Notifications
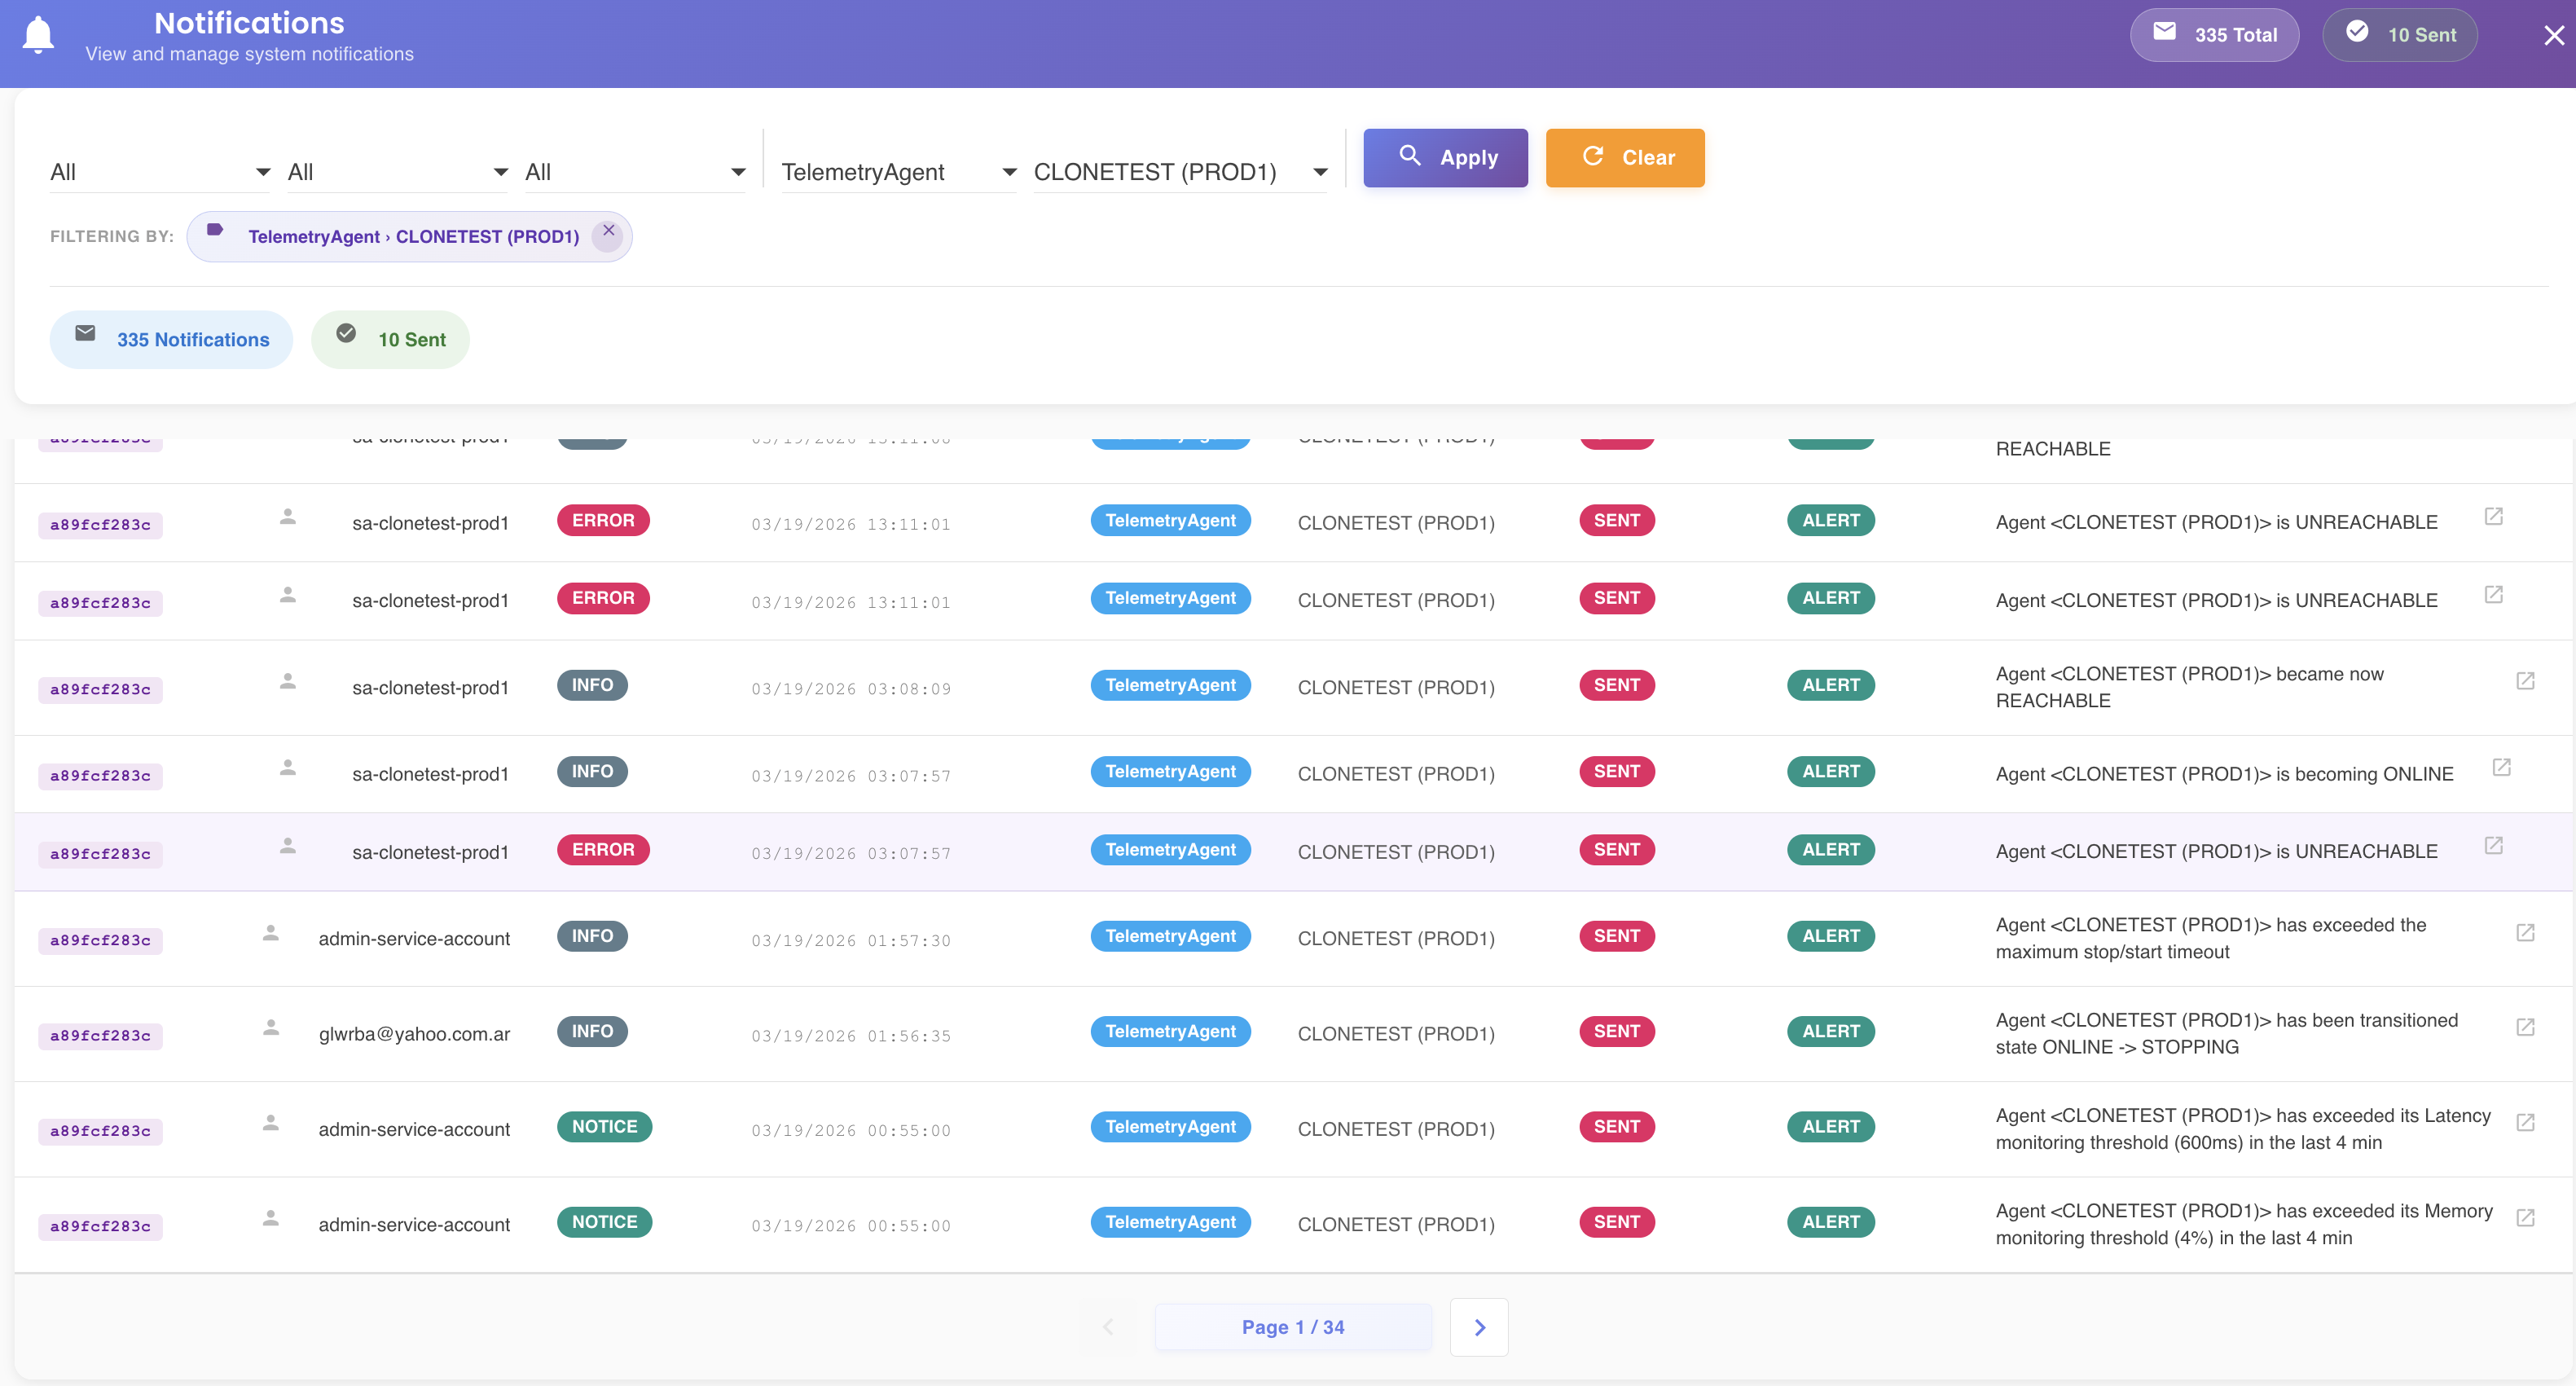
Every SLA state change — both when a breach is triggered and when it is cleared — automatically generates an entry in BizMetry's notification system, provided Alerts Generation is enabled for that metric. These notifications are accessible at any time from the main menu under Notifications, and can be filtered by agent to review the full breach history for a specific agent.
This audit trail is useful for understanding recurring patterns, correlating breaches with deployments or configuration changes, and demonstrating SLA compliance over time.