General Configuration
The General tab is the default landing tab of the Agent Configuration dialog and controls the fundamental behavior of the agent — covering metric capture and storage, memory management, synchronization frequency, and logging.
Accessing the Agent Configuration Dialog
The configuration dialog can be opened from two different locations within BizMetry.
Option A — From the Main Agents Panel
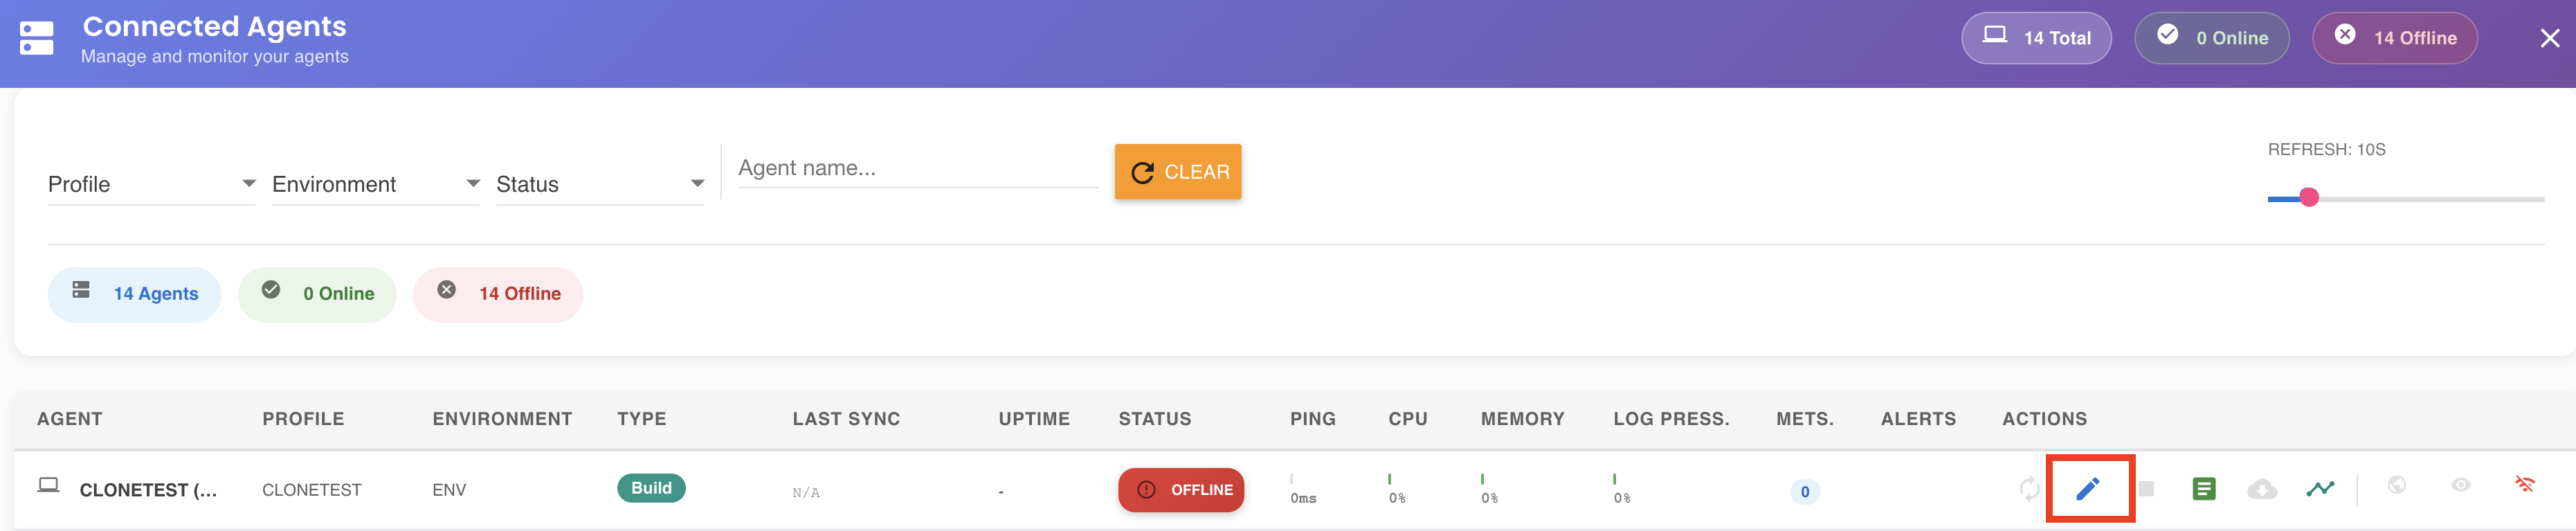
From the Home screen, open the main menu and select Agents. In the global agent list, locate the target agent and click the Edit Properties icon on its row.
Option B — From the Profile Agent Tab
Navigate to the relevant profile card from the Home screen, open the secondary menu, and select Agents. In the Agents tab, locate the agent card and click the Edit Properties icon on its action toolbar.
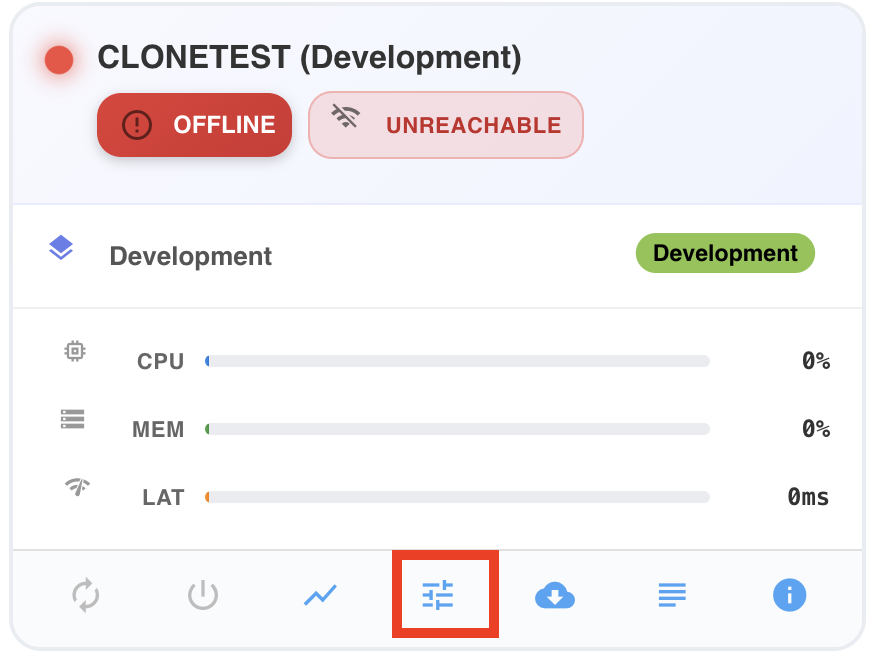
In both cases, the Agent Configuration dialog opens and lands on the General tab by default.
General Parameters
Agent Name
The display name assigned to this agent within BizMetry. This name is shown across the platform — in the agent summary, the agent card, log entries, and notification messages. Choose a name that clearly identifies the agent's purpose and associated environment.
Sync Interval (seconds)
Defines how frequently the agent synchronizes with the BizMetry platform. During each synchronization cycle, the agent transmits buffered metrics, flushes log batches, and receives any pending configuration or control signals.
This setting has a direct impact on platform responsiveness and network usage:
| Value | Behavior |
|---|---|
| High | Less frequent synchronization. Lower network usage, but slower platform reaction to changes in agent state, metrics, and logs. |
| Low | More frequent synchronization. Higher network usage, but significantly faster platform responsiveness to agent-side changes. |
💡 The sync interval also determines how quickly BizMetry detects agent state transitions — such as OFFLINE, RESTARTING, or ONLINE. A shorter interval translates to faster detection and more responsive monitoring dashboards.
Metric Storage Parameters
These three parameters govern the virtual memory model used by the agent to manage metric capture, local buffering, and transmission to the BizMetry platform via the RMTP protocol. They directly affect I/O frequency, memory footprint, disk usage, and overall metric throughput.
⚙️ These parameters should be planned carefully and tuned together, as they are interdependent. The goal is to find an effective trade-off between resource consumption (disk, memory, and network bandwidth) and total agent throughput.
Metrics Disk Buffer Size (KB)
Defines the amount of disk space reserved as a persistent buffer where metrics are temporarily stored on the agent before being transmitted to the platform during each sync cycle. This buffer acts as the primary resilience layer for metric data.
| Value | Behavior |
|---|---|
| High | Larger buffer. Greater resilience during connectivity loss — the agent can continue storing metrics locally for longer before data loss occurs. Higher disk usage. |
| Low | Smaller buffer. Reduced disk usage, but limited resilience. If the agent loses connectivity with the platform and the buffer fills up, incoming metrics will be dropped and permanently lost. |
Metrics Memory Buffer Size (KB)
Defines the amount of RAM allocated for in-memory metric management before metrics are persisted to the disk buffer. This layer sits between the live metric capture pipeline and the disk buffer, reducing the frequency of disk I/O operations.
| Value | Behavior |
|---|---|
| High | More metrics held in memory before flushing to disk. Fewer disk I/O operations, better write performance. Higher memory usage. |
| Low | Metrics are flushed to disk more frequently. Lower memory footprint, at the cost of increased disk I/O activity. |
Upload Block Size (KB)
Defines the size of each RMTP packet uploaded to the BizMetry platform when metrics are transmitted during a sync cycle. This directly controls the number of metrics transmitted per sync and the overall metric throughput.
| Value | Behavior |
|---|---|
| High | More metrics transmitted per sync cycle. Significantly higher throughput (metrics/second). Higher network bandwidth consumption per cycle. |
| Low | Fewer metrics transmitted per sync cycle. Lower bandwidth usage per cycle, but reduced throughput. May cause metrics to accumulate in the disk buffer if the capture rate exceeds the transmission rate. |
Logging Parameters
These two parameters control how the agent manages log data — from in-memory buffering to transmission batch sizing. They are critical for ensuring that log data reaches the platform reliably and without creating resource pressure on the agent.
📊 Always monitor the agent's Log Pressure indicator in the Agent Monitoring view when tuning these parameters. Log Pressure reflects the current utilization level of the log buffer in real time. If this value trends upward, the agent is not flushing logs fast enough and corrective action should be taken (see Tuning Guidance below).
Log Buffer Size (KB)
Defines the size of the in-memory ring buffer used to accumulate log entries before they are flushed to the platform during each sync cycle.
| Value | Behavior |
|---|---|
| High | Larger buffer. Greater resilience during connectivity loss — logs are held in memory until the connection is restored. Higher memory usage. |
| Low | Smaller buffer. Reduced memory usage. If the agent loses connectivity for an extended period, the buffer may fill up and the agent will begin dropping log entries, causing permanent log loss. |
Log Batch Size (KB)
Defines the size of each log batch transmitted to the BizMetry platform per sync cycle.
| Value | Behavior |
|---|---|
| High | More log data transmitted per cycle. Higher log throughput, at the cost of increased memory and network bandwidth usage. |
| Low | Less log data transmitted per cycle. Lower resource usage, but reduced throughput. If the agent generates logs faster than they can be flushed, a log bottleneck condition may develop, causing the buffer to fill and log entries to be dropped. |
Tuning Guidance
The Log Pressure metric, visible in the Agent Monitoring view, is the primary indicator for evaluating the health of the logging pipeline. It represents the current utilization level of the log buffer as a percentage.
Log Pressure should remain stable and low at all times. A rising trend indicates that the agent cannot flush logs fast enough relative to the rate at which they are being generated. If this occurs, apply the following corrective actions in order:
- Increase Log Batch Size — This is the first and most effective lever. A larger batch size allows more log data to be transmitted per cycle, directly increasing flush throughput.
- If throughput is still insufficient — increase Log Buffer Size — A larger buffer provides more headroom and reduces the risk of log drops while the throughput issue is being resolved.
- Reduce the Sync Interval — More frequent sync cycles mean logs are flushed more often, reducing the time data spends in the buffer.
Never ignore a rising Log Pressure
A sustained increase in Log Pressure is a leading indicator of impending log loss. Once the buffer is full, the agent silently drops new log entries — there is no error raised and the lost data cannot be recovered. Address the condition proactively before the buffer saturates.
Kubernetes Resource Implications
Buffer sizing has a direct impact on the resource footprint of the agent Pod once deployed in the Kubernetes cluster. This must be taken into account when planning the agent configuration, particularly in environments where cluster resources are constrained or shared.
- Memory buffers — Increasing the Metrics Memory Buffer Size and/or the Log Buffer Size causes the agent Pod's memory consumption to grow proportionally. Large memory buffers can significantly increase the memory request and limit that needs to be allocated to the Pod.
- Disk buffers — Increasing the Metrics Disk Buffer Size causes the agent Pod to claim a larger Persistent Volume. Oversizing this value across multiple agents can exhaust available storage capacity in the cluster.
Start conservative — tune incrementally
It is strongly recommended to begin with a conservative baseline configuration and increase buffer sizes only when there is a demonstrated need, evaluating the results of each change before proceeding further. Avoid pre-emptively raising buffers beyond what the workload actually requires.
Factors that influence the right configuration
The optimal configuration depends on several variables specific to each deployment. The most relevant ones are:
Profile complexity Profiles with a larger number of frames, business events, and complex APIs to trace produce metrics that are larger in size and/or higher in volume. This translates into a greater metric footprint at the agent level, which may justify larger disk and memory buffers.
Application throughput Applications with higher transaction throughput generate a proportionally higher volume of instrumentation data and metrics. High-throughput environments place greater pressure on both the metric pipeline and the logging pipeline simultaneously, making buffer sizing more critical.
Kubernetes storage speed The I/O performance of the underlying storage infrastructure has a significant effect on buffer flushing speed. SSD-backed Persistent Volumes and fast storage classes can substantially reduce disk I/O latency, allowing the agent to flush buffers more efficiently and reducing the effective buffer size needed to maintain stable operation.


