Agents
BizMetry organizes the collection and capture of business metrics through distributed agents that can be deployed across the different environments that form part of the Template Release Pipeline. Each agent is an independent process that runs within the customer's infrastructure — whether on-premises in a datacenter or in the cloud.
What is a BizMetry Agent?
An agent is a lightweight, autonomous process responsible for capturing metrics generated by business applications deployed in a given environment. Agents can collect metrics in two ways:
- Auto-instrumentation — The agent automatically discovers and instruments business applications without requiring code changes. This requires no-coding.
- Programmatic instrumentation — Metrics are explicitly submitted by applications via the BizMetry SDK. This requires low-coding.
Agent Lifecycle within the Release Pipeline
For every environment defined within the Template Release Pipeline, BizMetry automatically creates and assigns a dedicated agent. Newly created agents start in an unconfigured state and must be properly configured before they can be downloaded and deployed in the customer's environment.
Agents support a wide range of configuration options, including:
- Metric collection, capture, filtering, and storage behavior.
- Deployment target settings (host, port, network configuration).
- Log verbosity levels for debugging purposes.
- Security and authentication settings.
Accessing the Agents Tab
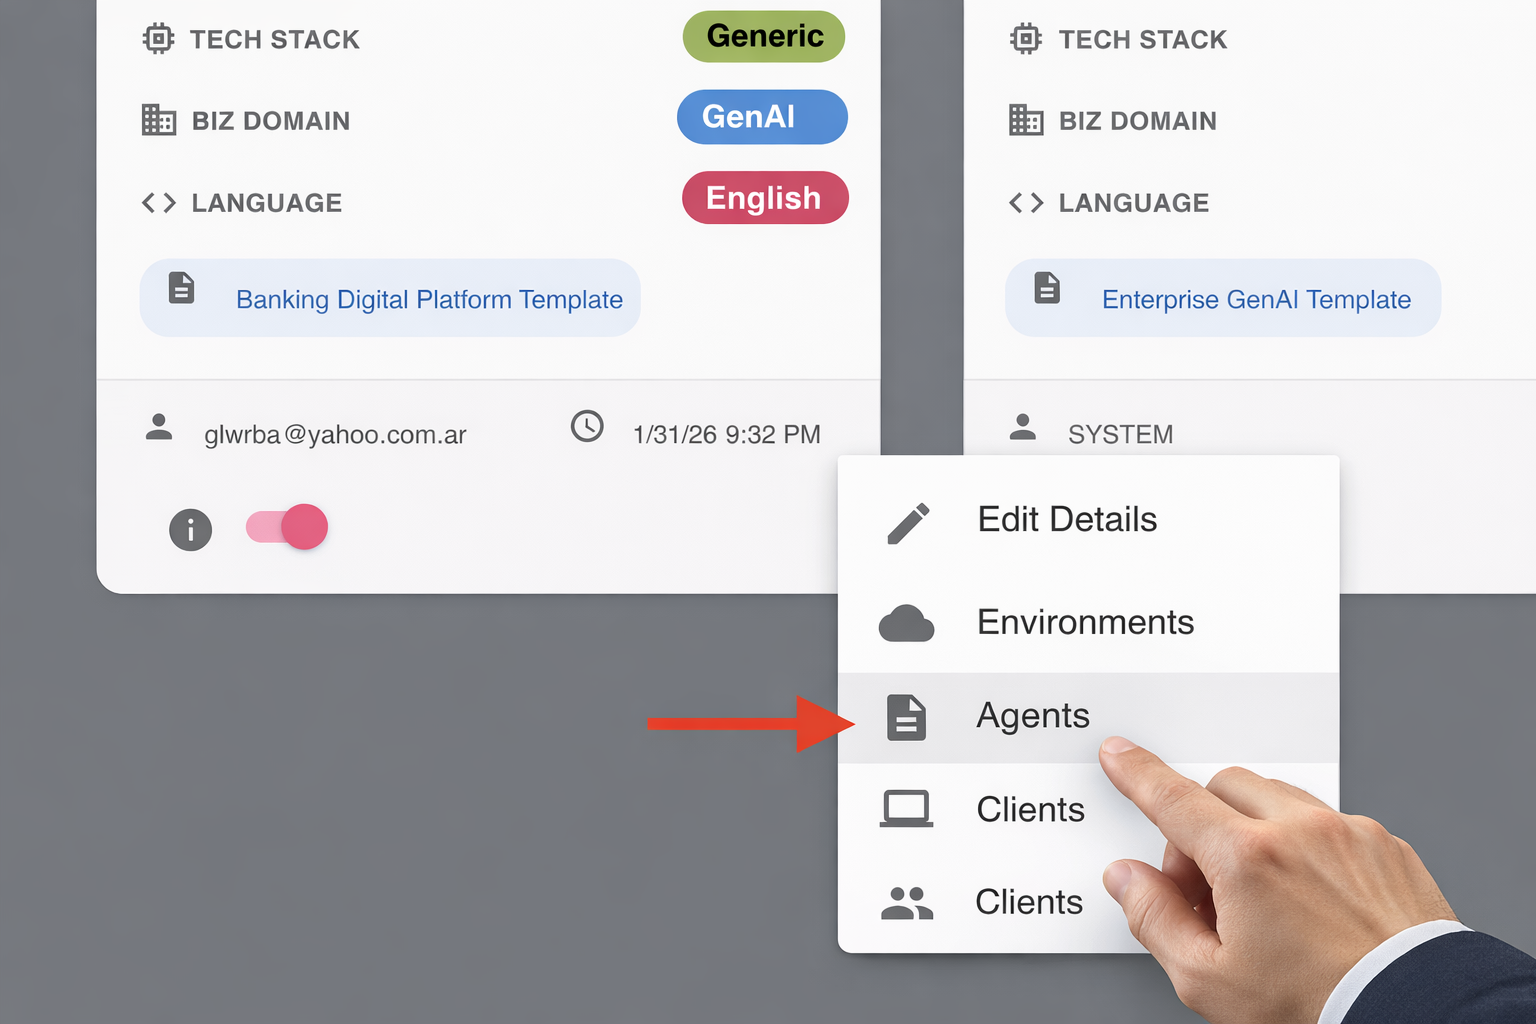
- Locate the profile in the Profile Canvas.
- Click the ellipsis icon (three dots) in the bottom-right corner of the profile tile.
- Select Agents from the contextual menu.
The Profile Dialog opens and navigates directly to the Agents tab.
Agent Summary View
Upon landing on the Agents tab, the Agent Summary is displayed, listing all agents associated with the profile along with their current status and operational information.
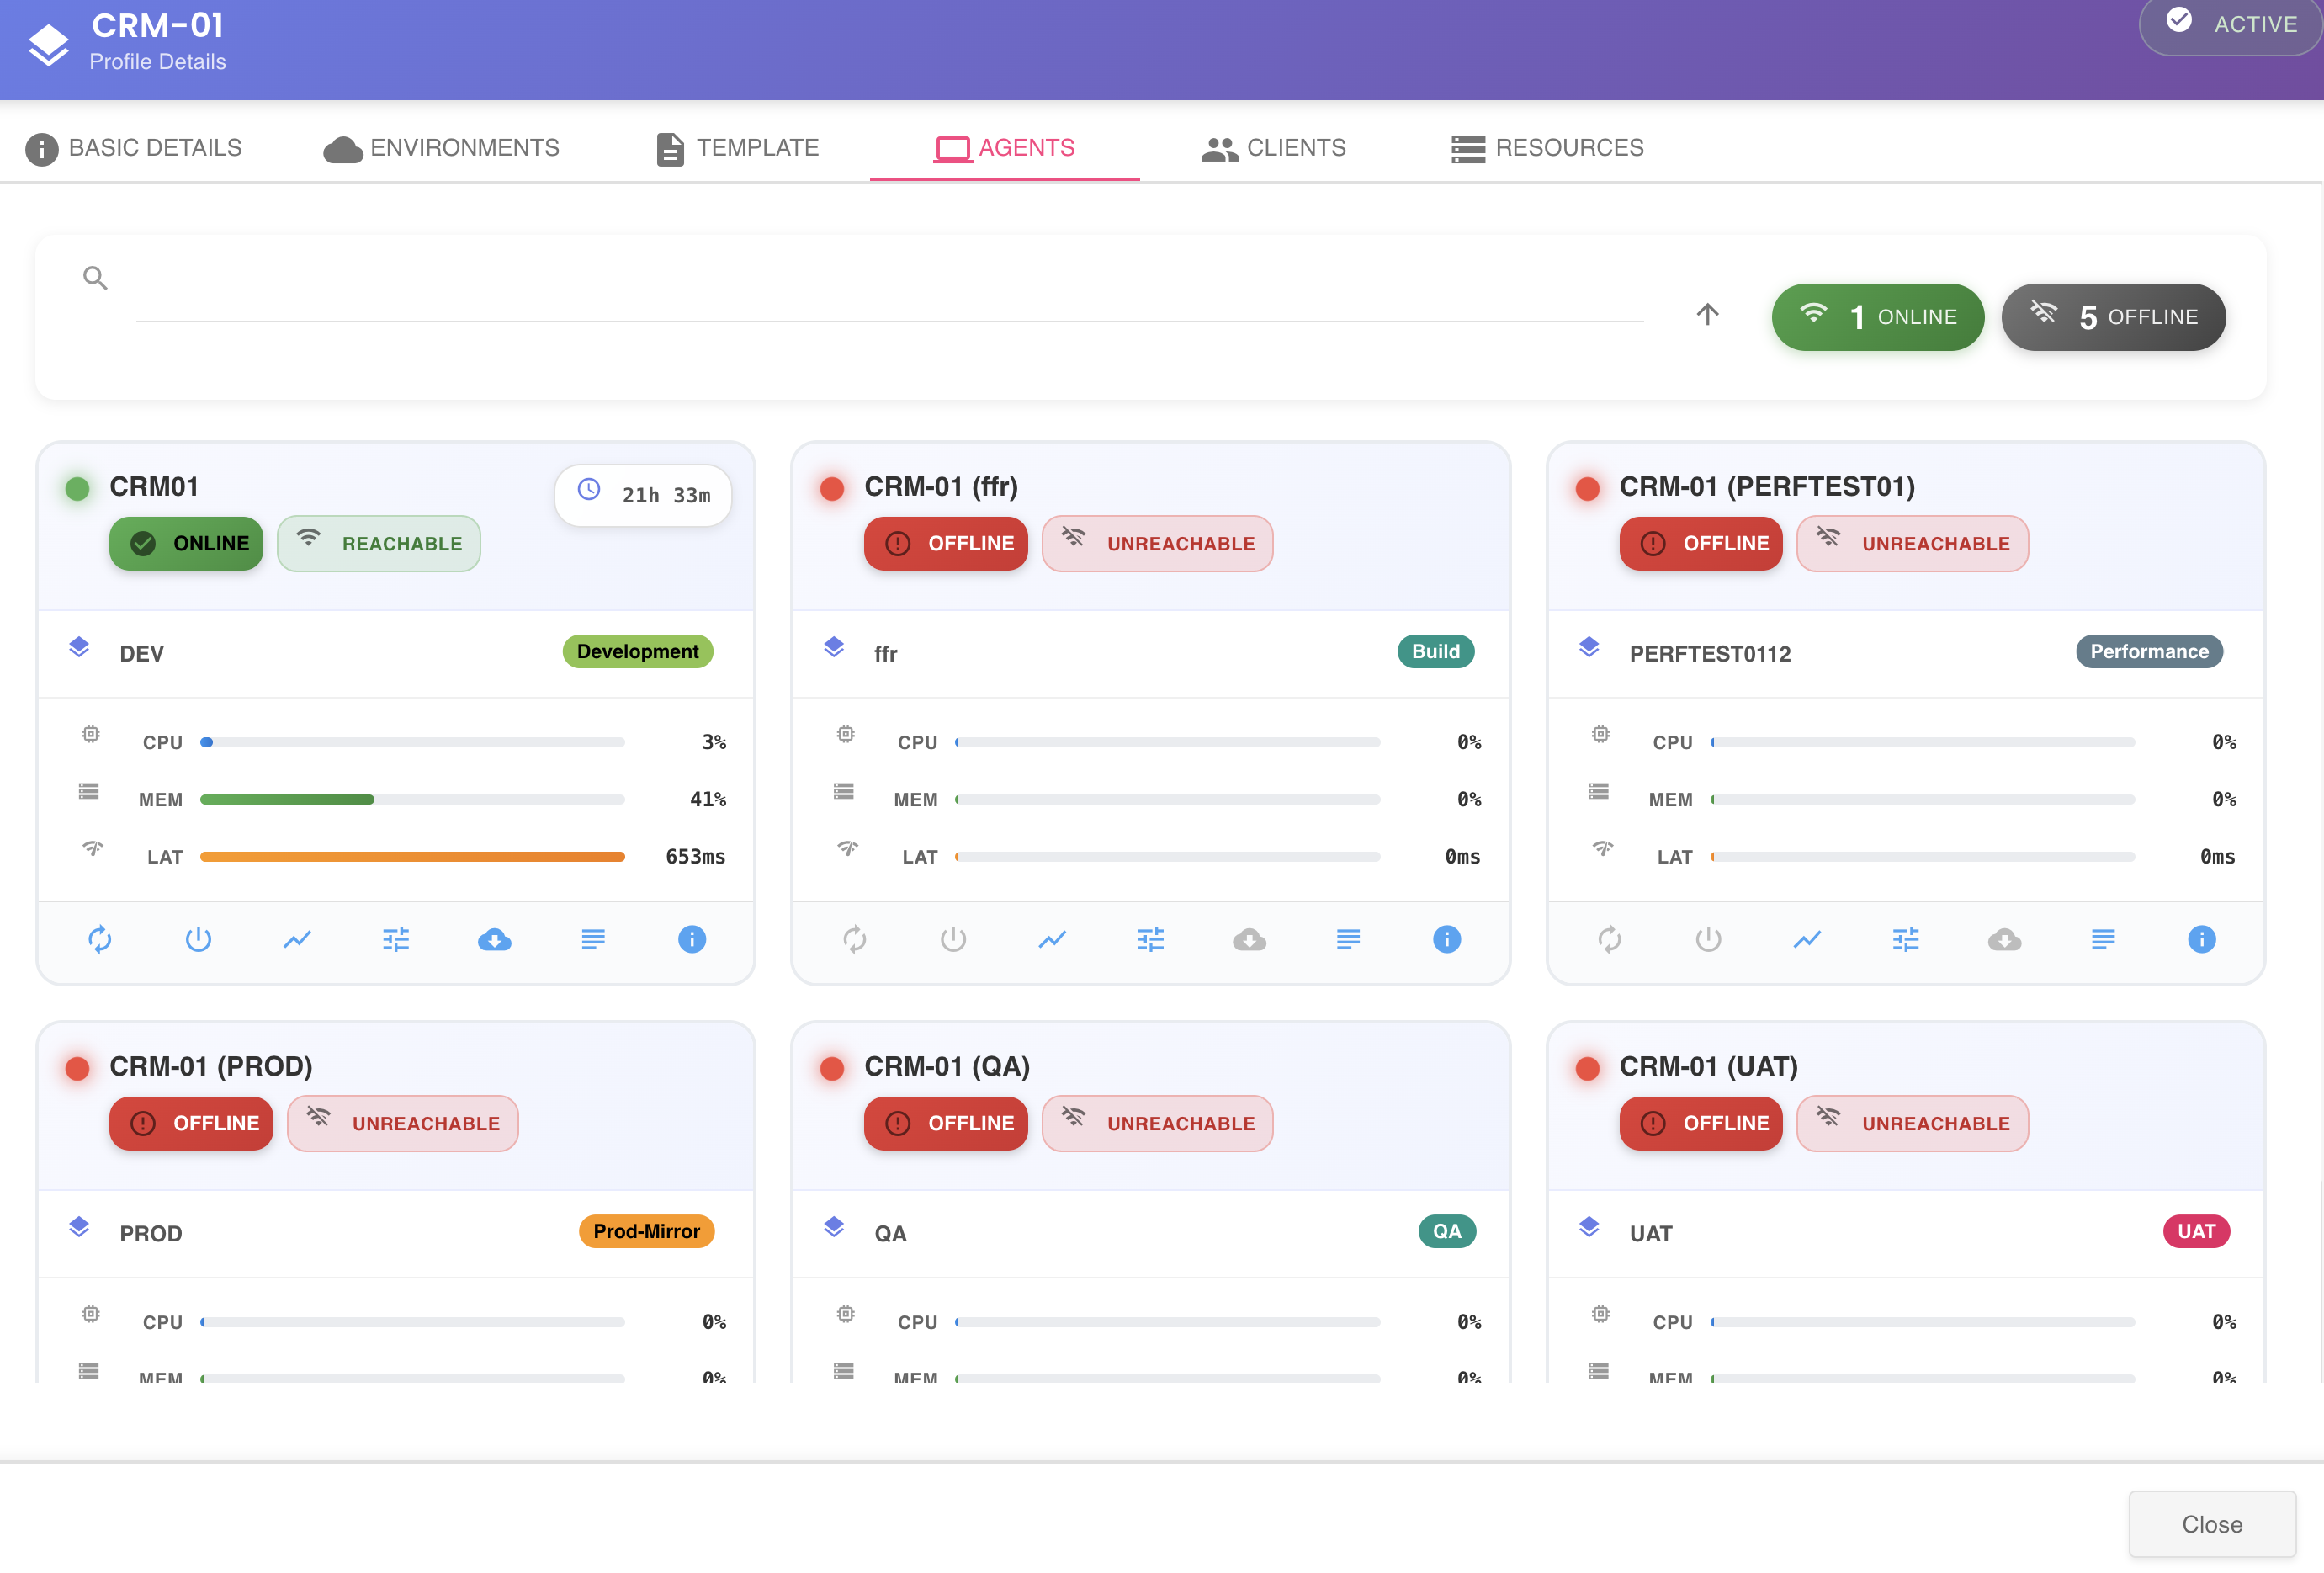
This view provides a general operational overview, allowing you to quickly identify which agents are active, which environments they are associated with, and their current health state.
Agent Status
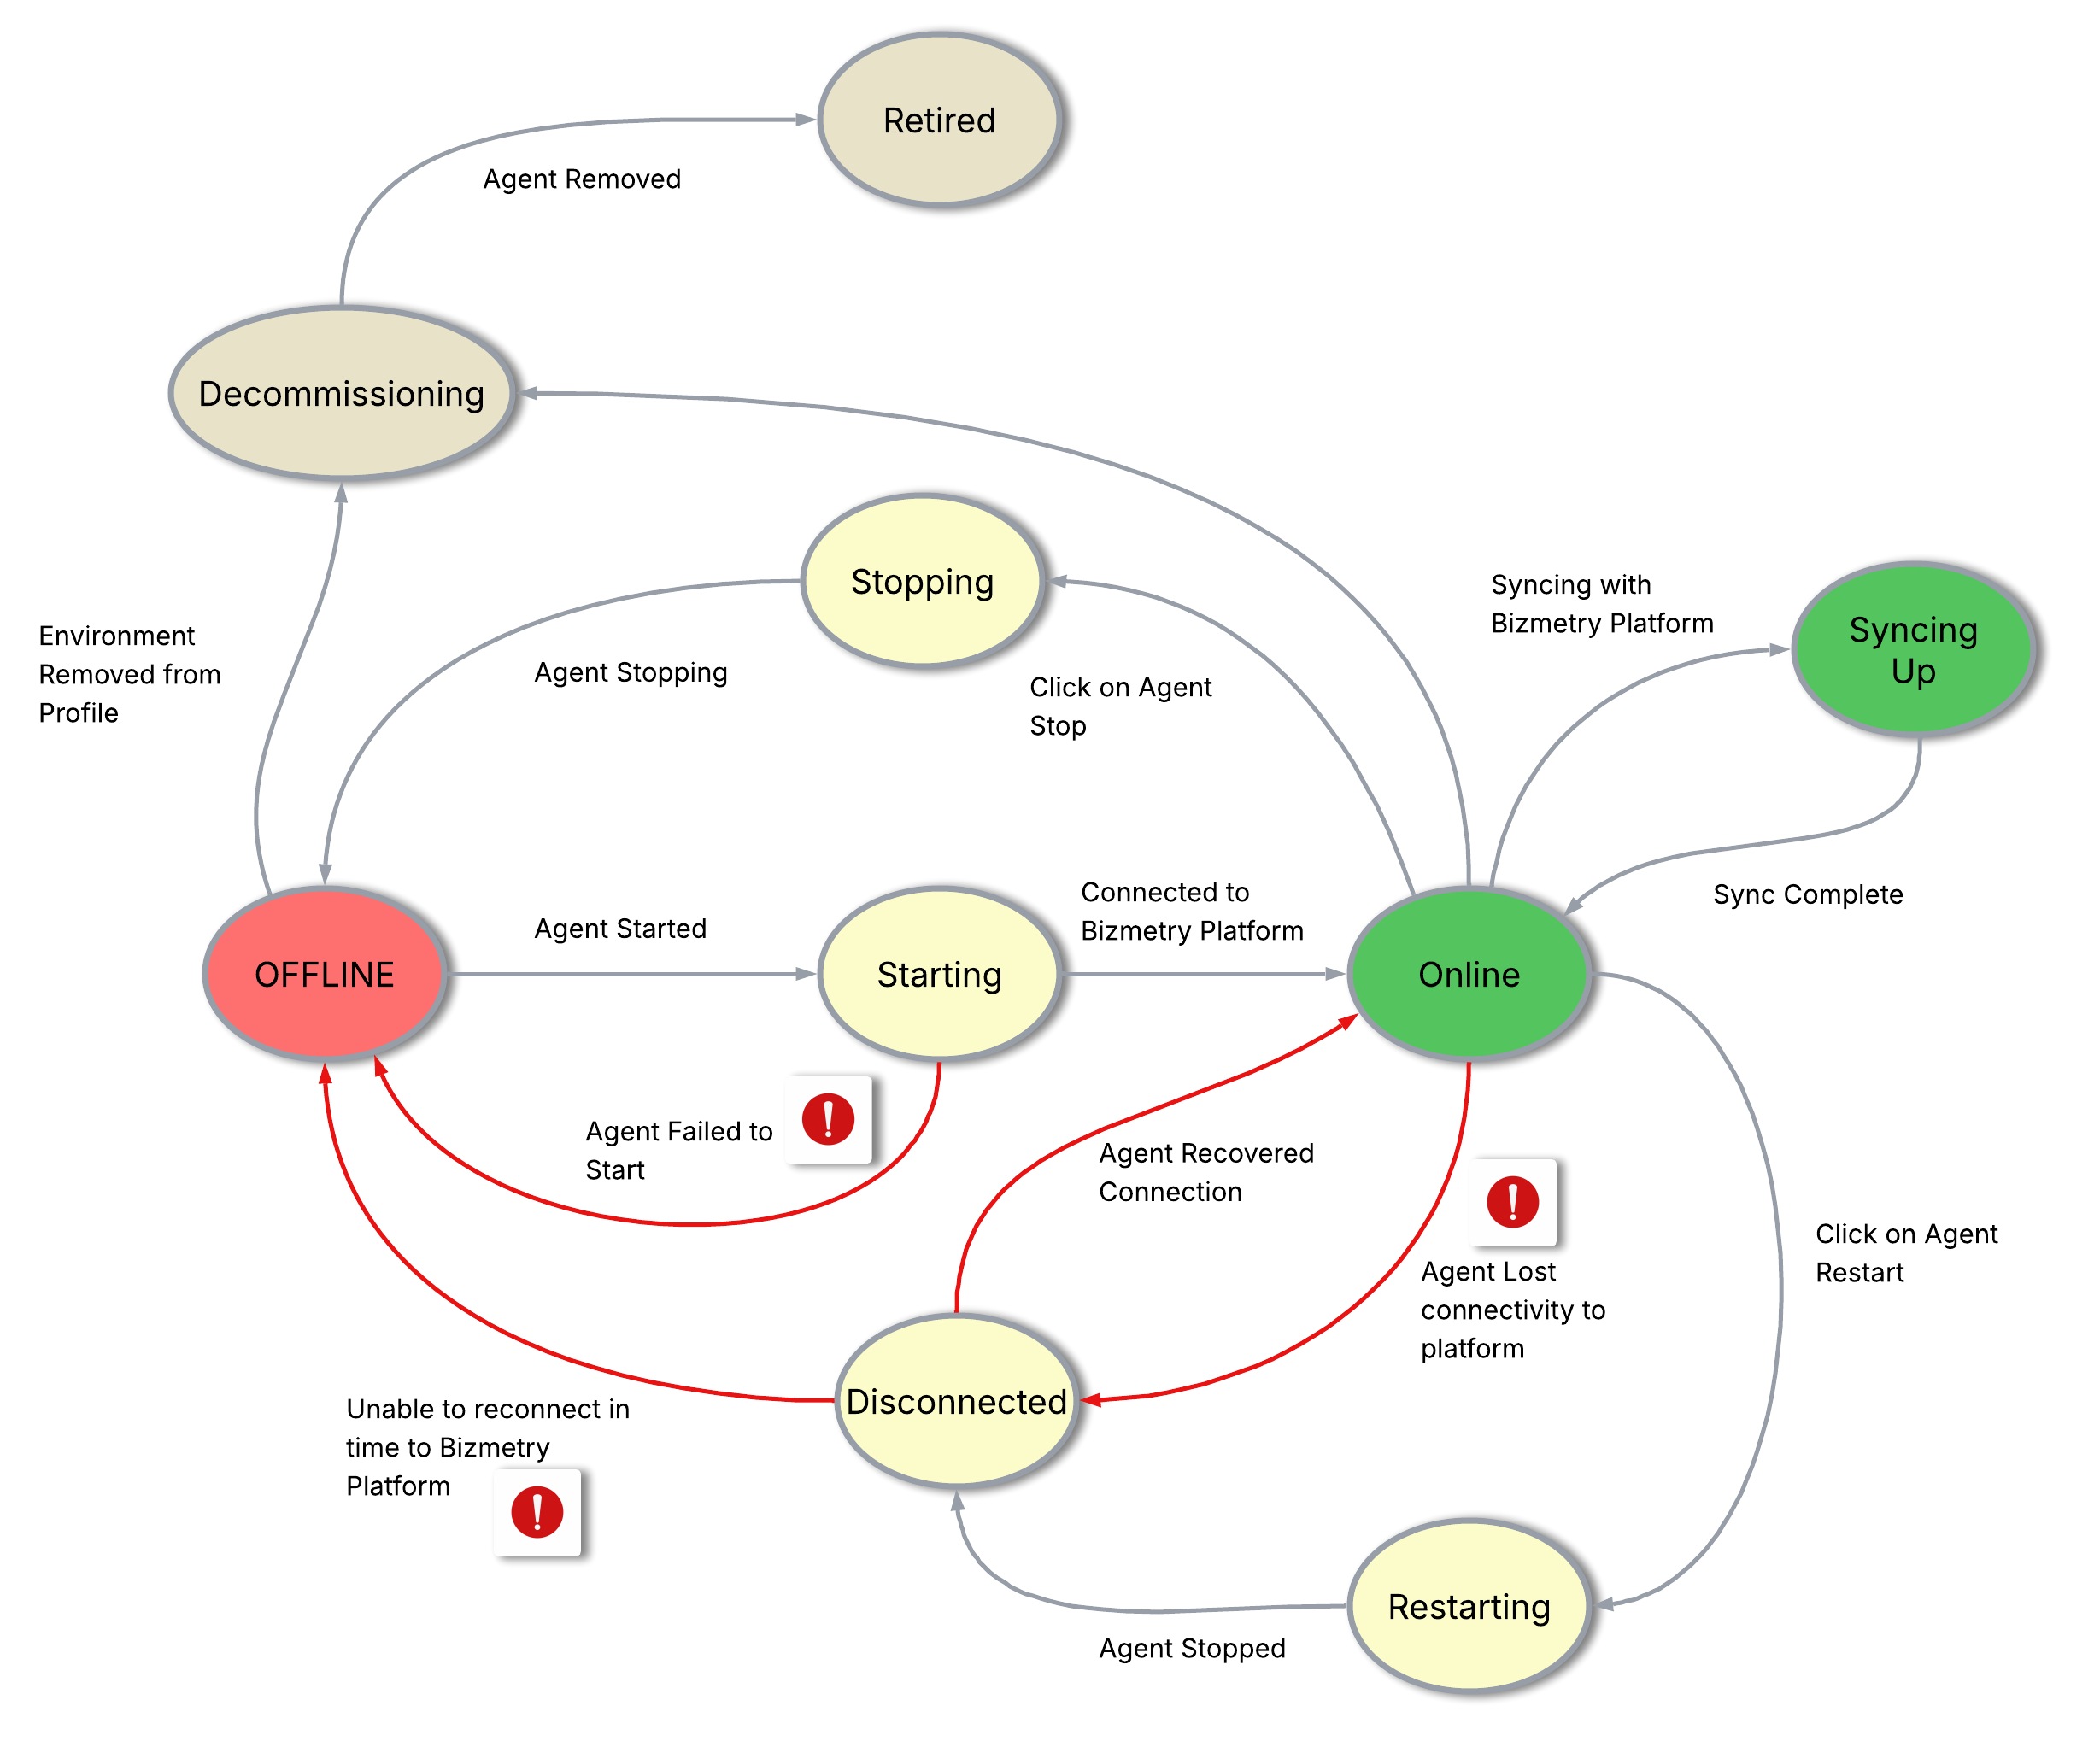
An agent can be in one of the following states within the BizMetry agent lifecycle:
| Status | Indicator | Description |
|---|---|---|
| ONLINE | Green | The agent is fully operational and connected to the BizMetry platform. It can capture, collect, and transmit metrics. |
| OFFLINE | Red | The agent is not running and is disconnected from the platform. No metrics are captured or transmitted. |
| STARTING | Yellow | The agent is in the process of starting up. |
| STOPPING | Yellow | A stop action has been initiated. The agent is in the process of halting its execution. |
| RESTARTING | Yellow | A restart action has been initiated. The agent is currently restarting. |
| DISCONNECTED | Yellow | The agent has temporarily lost connectivity with the platform. It may still collect metrics locally but cannot transmit them or synchronize with BizMetry. |
| SYNCING_UP | Yellow | The agent is actively synchronizing with the platform, exchanging data such as logs and collected metrics. |
| DECOMMISSIONING | Yellow | The agent has been deleted and is in the process of de-registering and removing itself from the platform. |
| RETIRED | — | The agent has been fully removed and retired from BizMetry. |
The following diagram illustrates the agent state machine and the transitions between states:
Visual Status Indicators
In the Agent Summary, the status of each agent is conveyed visually through a colored circle on each card:
- Green — Agent is
ONLINE. - Red — Agent is
OFFLINE. - Yellow — Agent is in any other transitional state (
STARTING,STOPPING,RESTARTING,DISCONNECTED,SYNCING_UP,DECOMMISSIONING).
Pending-Change Indicators
Independently of its status, an agent's card can show a small round indicator icon when configuration changes have been saved that the running agent has not applied yet. Hover over the icon for a description:
| Icon | Indicator | Meaning |
|---|---|---|
| Restart Required | The agent has undergone changes that require a restart for them to become effective. | |
| Redeploy Required | The agent has undergone changes that require a full re-install of the agent for them to become effective. |
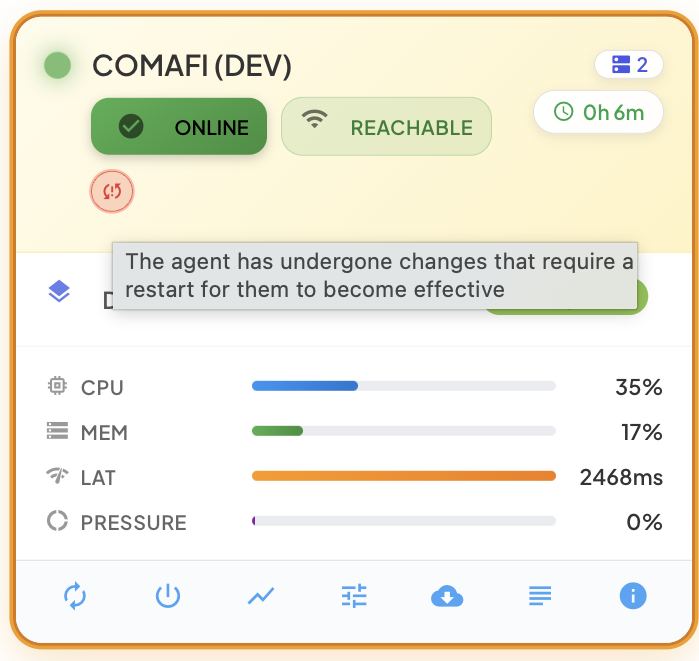
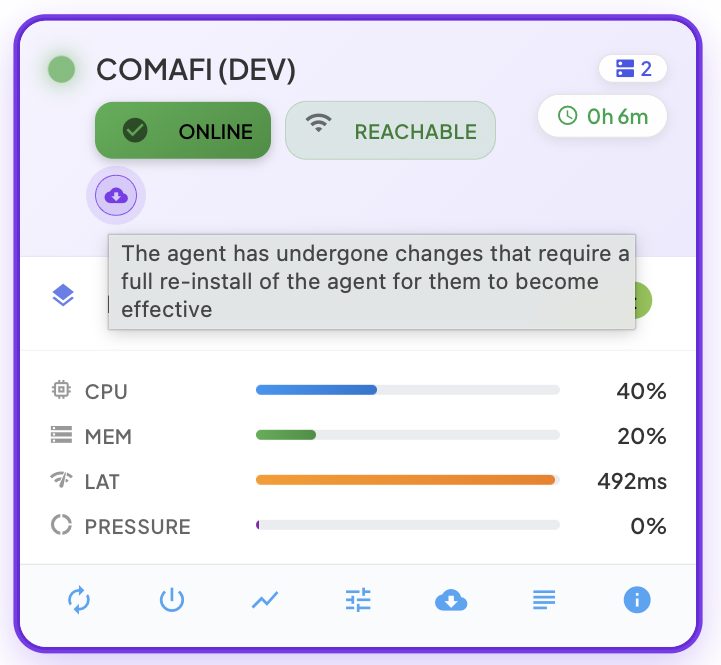
The card's accent color changes as well, so agents with pending changes stand out in the list. If both kinds of change are pending, only Redeploy Required is shown, since reinstalling the agent also restarts it. See Breaking vs Non-Breaking Changes for which settings trigger each indicator.
Search and Status Badges
At the top of the Agents tab, two informational elements are displayed:
Status Badges
Two badges provide an at-a-glance count of: - Online agents — the number of agents currently in ONLINE state. - Offline agents — the number of agents in any non-ONLINE state.
These badges update automatically as the agent list is filtered.
Search Bar
A search bar allows you to filter the agent list in real time by typing a search term. The filter applies across:
- Agent name
- Environment name
- Agent description
The agent list updates instantly as you type.

Agent Card Structure
Each agent is represented by a card in the summary grid. Every card contains the following information:
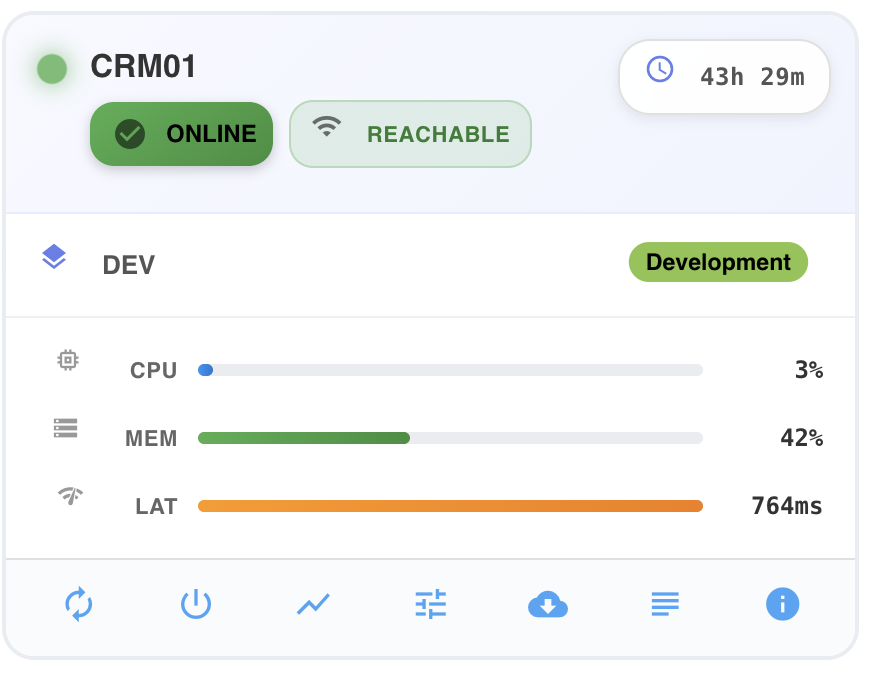
| Section | Field | Description |
|---|---|---|
| Header | Agent Name | The unique name identifying the agent. |
| Agent Status | Current operational state pill and colored circle indicator. | |
| Reachability | Whether the agent endpoint is currently reachable (Reachable / Unreachable). | |
| Description | A brief description of the agent's purpose or deployment context. | |
| Replicas | The number of replicas (running instances) the agent currently has, shown as a small badge next to the name. See Capacity Configuration. | |
| Uptime | Total time the agent has been continuously ONLINE since its last startup (e.g., 4h 32m). Only shown when the agent is ONLINE. | |
| Environment | Environment Name | The name of the environment this agent is associated with. |
| Environment Type | The type of environment (e.g., Development, QA, UAT, Production). | |
| Performance | CPU | Current CPU usage of the agent process, displayed as a mini progress bar and percentage. |
| Memory | Current memory usage of the agent process, displayed as a mini progress bar and percentage. | |
| Latency | Network round-trip latency between the agent and the BizMetry platform (in milliseconds), displayed as a mini progress bar. | |
| Pressure | The agent's current backpressure — how much metrics are piling up relative to how fast they are delivered — displayed as a mini progress bar and percentage. See Understanding Backpressure Compensation for how the agent adapts to it, and Pressure SLA for how its breach threshold is configured. | |
| Action Toolbar | — | A row of action buttons for managing the agent (see below). |
Agent Action Toolbar
Each agent card includes an action toolbar at the bottom with the following actions:
| Action | Icon | Description |
|---|---|---|
| Restart | autorenew | Restarts the agent. Only available when the agent is ONLINE. Use it when the card shows the Restart Required indicator. |
| Stop | power_settings_new | Stops the agent. Only available when the agent is ONLINE. |
| Monitoring | show_chart | Opens the agent monitoring and statistics view. |
| Edit Properties | tune | Opens the agent configuration dialog to modify its settings. |
| Download | cloud_download | Downloads the agent package for deployment. Requires the agent to have security configuration fully set up. Use it when the card shows the Redeploy Required indicator. |
| View Logs | subject | Opens the agent log viewer. |
| Details | info | Opens the full agent details dialog. |
Agent SLA Breaches
BizMetry allows you to configure SLAs at the agent level to monitor and control agent resource usage. SLAs define thresholds over the agent's core metrics — CPU usage, memory consumption, network latency, and queue pressure — so that if those thresholds are exceeded for the configured time window, an SLA breach alert is triggered.
For more information on how to configure agent SLAs, refer to SLA Configuration.
Where breach alerts are displayed
When an SLA breach is triggered, BizMetry surfaces it in two places:
On the Agent Card
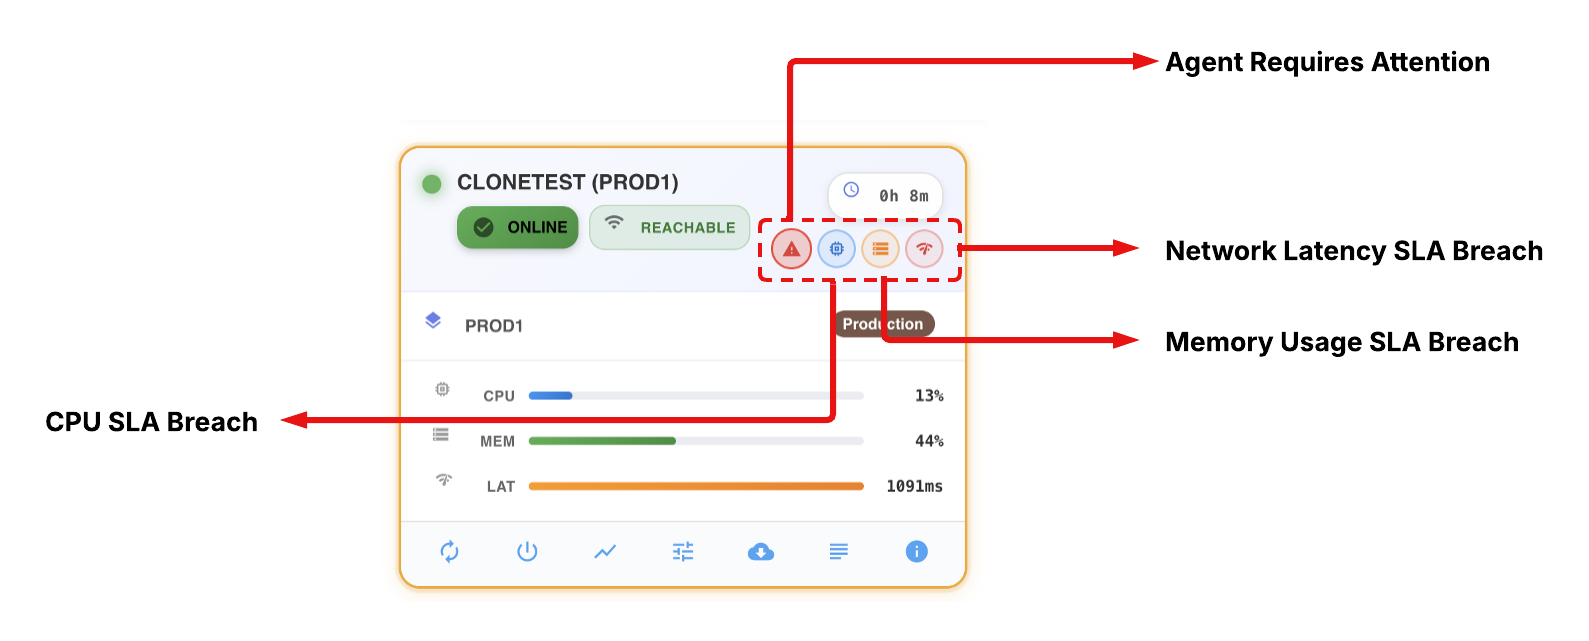
An alert icon appears directly on the affected agent's card, providing an immediate visual indication that at least one SLA breach is currently active. Hovering the icon shows a tooltip naming the breached resource and the threshold it crossed (e.g. "Pressure above threshold (80%)").
In the Agent Details Dialog
Opening the agent details dialog reveals the SLA Breaches section, which lists all currently active breach alerts. For each active breach, the following information is displayed:
- The affected resource (CPU, Memory, Network Latency, or Pressure).
- The timestamp at which the breach was detected.

Breach lifecycle
Active SLAs are monitored by BizMetry on a continuous, periodic basis:
- When a resource metric exceeds the configured SET threshold for the required Set Time window, the breach is triggered and the alert icon appears on the agent card.
- If the condition that caused the breach normalizes — meaning the metric drops below the CLEAR threshold and remains there for the required Reset Time window — the breach is automatically resolved and the alert icon is removed from the card without any manual intervention.
This hysteresis-based behavior prevents false positives and alert flapping caused by transient resource spikes.
Summary
The Agents tab allows you to:
- Monitor all agents associated with a profile at a glance.
- Identify the operational state of each agent through color-coded indicators and status badges.
- Search and filter agents by name, description, or environment.
- Inspect resource usage metrics including CPU, memory, network latency, and queue pressure per agent.
- Act on individual agents using restart, stop, configuration, download, log, and detail actions.