Profile Tiles Section

The Profile Tiles Canvas Section displays all monitoring profiles that match the filters and criteria defined in the navigation bar. Each tile represents a complete profile and summarizes key information such as domain, stack, language, template, and status.
Navigation Bar

The navigation bar at the top of the page allows you to browse, sort, search, and paginate through all profiles.
Sorting Dropdown
This dropdown allows selecting the sorting criteria for the profile tiles:
- Profile Name (Ascending)
- Profile Name (Descending)
- Project Name (Ascending)
- Project Name (Descending)
- Creation Timestamp (Ascending)
- Creation Timestamp (Descending)

Sorting is applied immediately when an option is selected.
Search Input (Type-Ahead)

The search input performs live, type-ahead filtering.
BizMetry searches through the following profile attributes:
- Profile Name
- Project Name
- Profile Description
Any text that matches these attributes will cause the corresponding profiles to appear dynamically.
Pagination Controls
Located on the right side of the navigation bar.
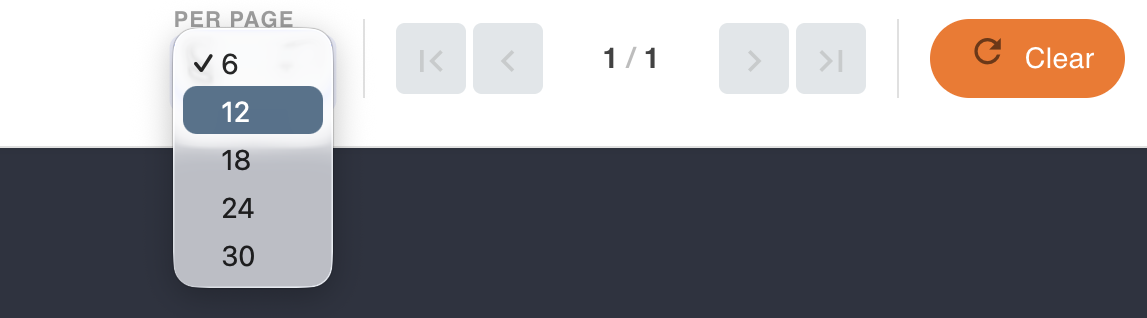
Page Size Dropdown
Allows selecting how many profile tiles are rendered on the profile canvas per page.
Pagination Buttons
- Next Page
- Previous Page
- First Page
- Last Page
Clear Button

Clicking Clear resets the following:
- Sorting criteria
- Search filters
- Pagination state
- Any applied filters
Once reset occurs, the profile canvas gets updated based on the new criteria.
Profile Tiles

Each tile visually represents a monitoring profile and is divided into three main sections.
A) Tile Header Section
Contains core identity and state of the profile:
- Profile Name
- Profile Description
- Profile Status — Active or Inactive
- Inactive profiles automatically silence business metric ingestion from agents until reactivated.
B) Tile Body Section
Shows key telemetry template details associated with the profile:
- Business Domain — From the selected telemetry template.
- Tech Stack — The underlying technical platform described by the template.
- Language — Preferred template language (English, Spanish, etc.)
- Template Name — The master/base template used to create the profile.
C) Tile Footer Section
Includes:
- Owner — The creator of the profile.
- Creation Timestamp — When the profile was created.
- Info Icon (i) — Opens the Profile Configuration Dialog.
- Active/Inactive Toggle
- Allows enabling or disabling the profile.
- When disabled, all business metrics from agents are silenced.
- Ellipsis Menu (⋮) — Opens the contextual submenu.
Profile Ellipsis Menu

The ellipsis icon (⋮) at the bottom-right corner of each profile tile opens a contextual submenu, providing direct access to several operations related to the selected profile.
Available Actions:
- Edit Details: Allows you to edit the profile’s name, description, and project associated with the profile.
- Environments: Opens a dialog where you can manage the environments linked to the profile, adding or removing them as necessary.
- Template: Opens the telemetry template assigned to the profile. You can view and edit the template from here.
- Agents: Displays and manages the telemetry agents connected to the profile. You can view the current agent status or perform actions like restarting or deactivating them.
- Clients: View all client components under this profile, allowing you to inspect the connections and configurations.
- Resources: Explore and manage the resources associated with the profile, including any system resources linked to the monitoring.
- Clone: Create a full duplicate of the profile, including its settings, template, environments, and agents.
- Export: Download the profile’s full configuration as a JSON definition, useful for backup or sharing purposes.
- Delete: Permanently remove the profile from BizMetry, along with all its associated environments, agents, clients, resources, and templates.
Tip
Note: The ellipsis menu adapts to the user’s permissions and roles. Depending on the logged-in user's access level, some actions may be restricted or unavailable.
Pro Tips
- Clicking the tile header will expand quick metrics or details.
- Profiles marked as Pending Setup display a yellow indicator until they receive their first telemetry event.
- The options in the ellipsis menu are role-based, so users with restricted permissions might not see all actions.